Categories
Macro

Fair value exchange rates in EM Asia

  • FX fair value estimates for eight EM Asia economies point to more over- rather than under-valuation across the region…
  • …so the real depreciations registered by most of the region’s currencies last year has pushed many (but not all) towards fair value.
  • Inflation differentials are now playing a larger role in determining REERs compared to the pre-pandemic era.

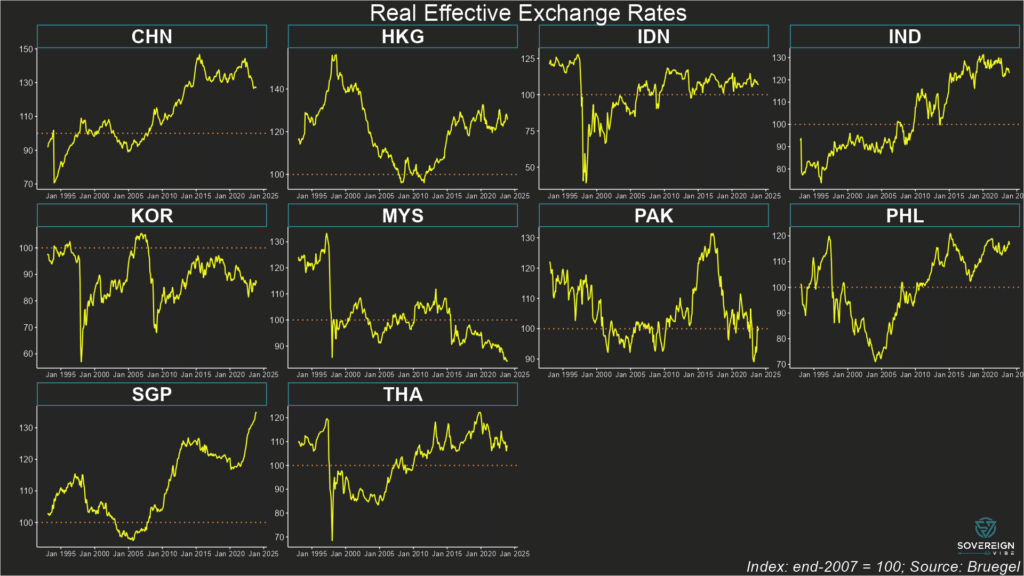
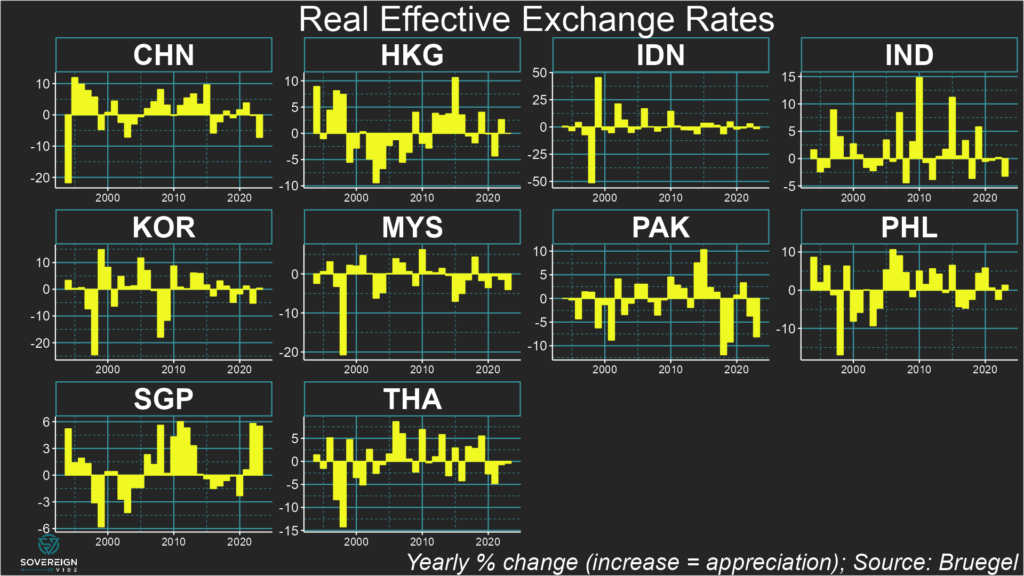
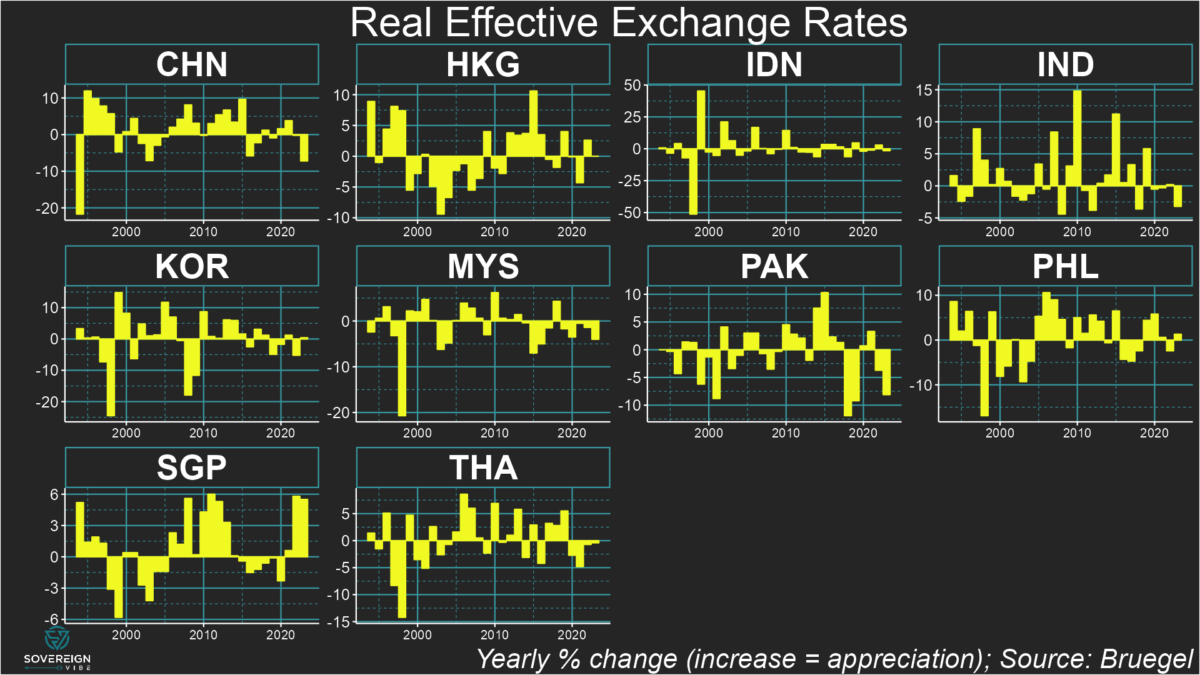
Currencies in emerging markets Asia mostly declined in real terms in 2023. Pakistan registered the sharpest real exchange rate depreciation, though China also weakened significantly on the back of much less inflationary pressure in the country relative to its trading partners.
REER trends in EM Asia

Of the eight EM Asia countries covered below, only the Philippine peso and Korean won strengthened in real terms in 2023, though the Singaporean and (possibly) Hong Kong dollars were also in positive territory for the year.

For each country, I provide a chart that breaks down the contributions of to the real exchange rate:

  • The nominal effective exchange rate: Remember that “effective” implies a trade-weighted calculation against all trading partner currencies.
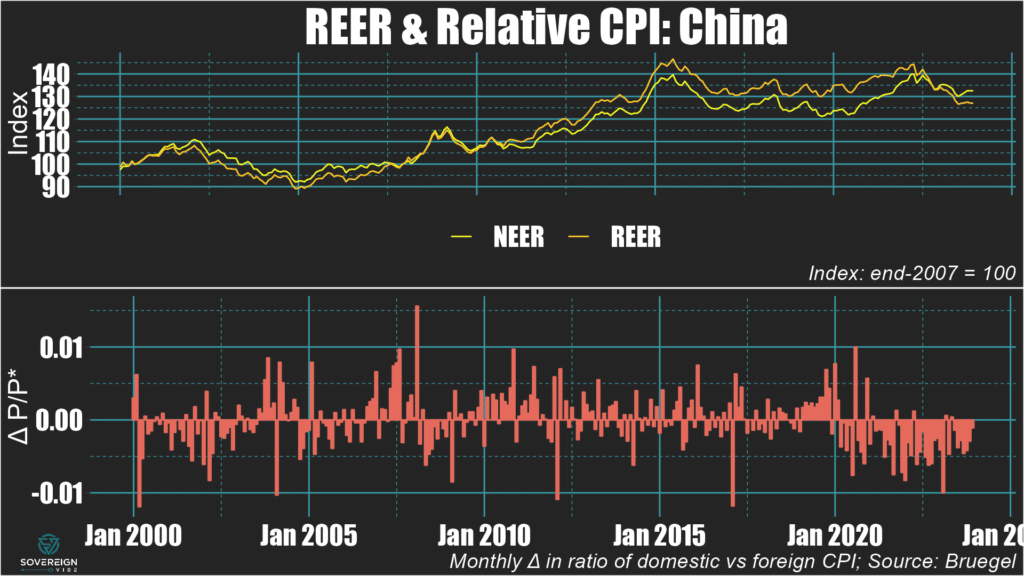
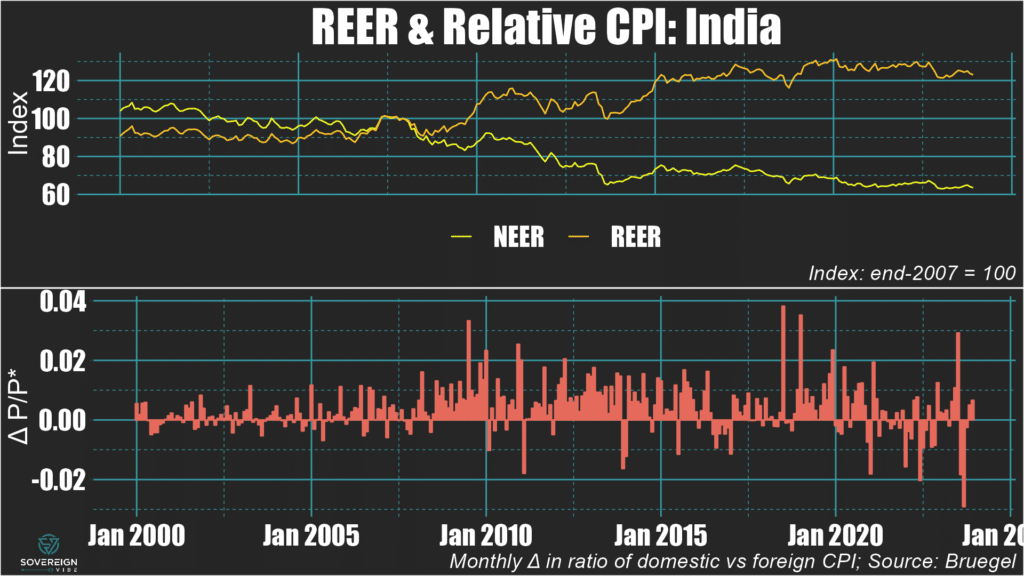
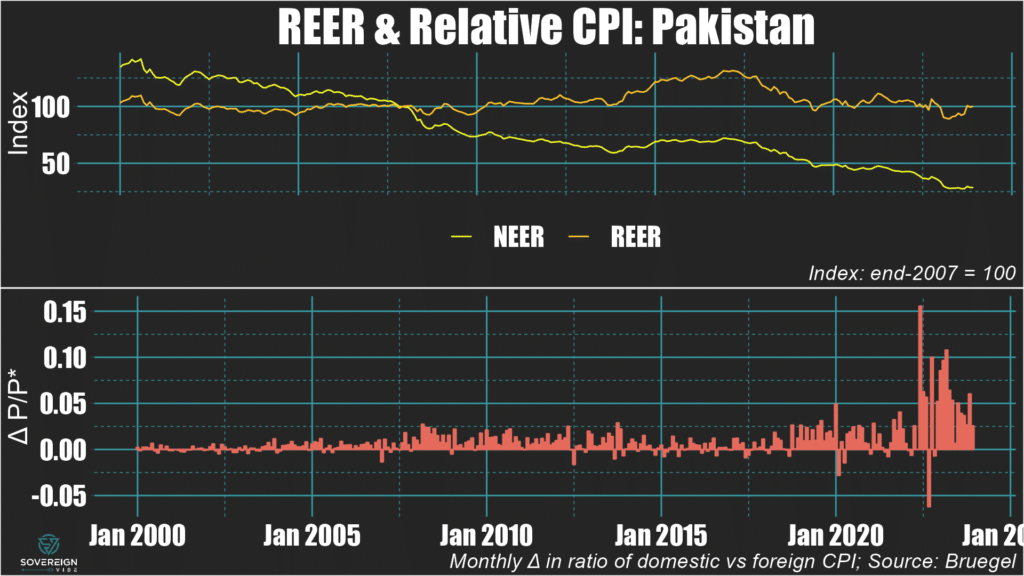
  • Inflation differentials: This indicator looks at the month-on-month changes of the ratio of the domestic country’s consumer price index versus the trade-weighted CPIs of its trading partners. A positive (negative) differential means that the domestic country is experiencing higher (lower) inflation than its trading partners are.

As for fair values, those are covered in the next section of this post.
🇨🇳 China: The yuan depreciated by around 7.5% in real terms in 2023, on the back of two years of mild appreciation. Despite some nominal weakening, it is mostly inflation differentials driving the real depreciation, as deflationary pressures in the Middle Kingdom stand in marked contrast to the rising prices experienced by its trading partners in recent years.
🇮🇳 India: The rupee experienced a real depreciation of about 3% in 2023 against its trading partners. Comparatively low inflation and some nominal currency weakening in H2 were both at play.
🇵🇰 Pakistan: The rupee declined by around 8% in real terms in 2023, following a smaller drop the previous year. The decrease in nominal effective terms was even larger, as inflation in Pakistan was higher than that of its trading partners for the entire year.
🇮🇩 Indonesia: The rupiah’s real exchange rate was fairly stable in 2023, registering a very modest decline in real and nominal terms alike. Inflation differentials were small and alternated between positive and negative over the course of the year, so had a negligible effect.
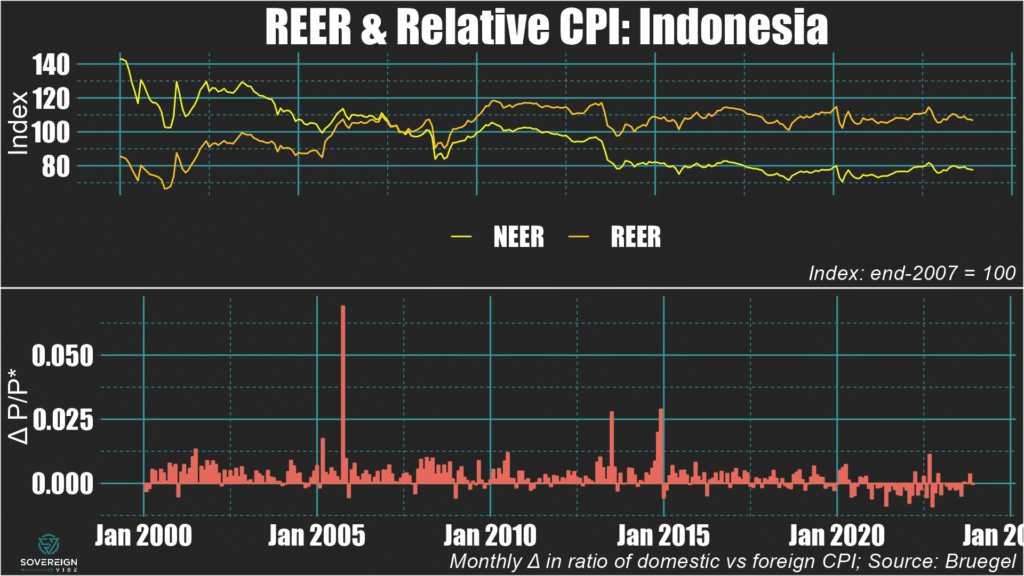
🇲🇾 Malaysia: The ringgit depreciated by nearly 5% in real terms over the course of 2023, with both nominal weakening and negative inflation differentials contributing.
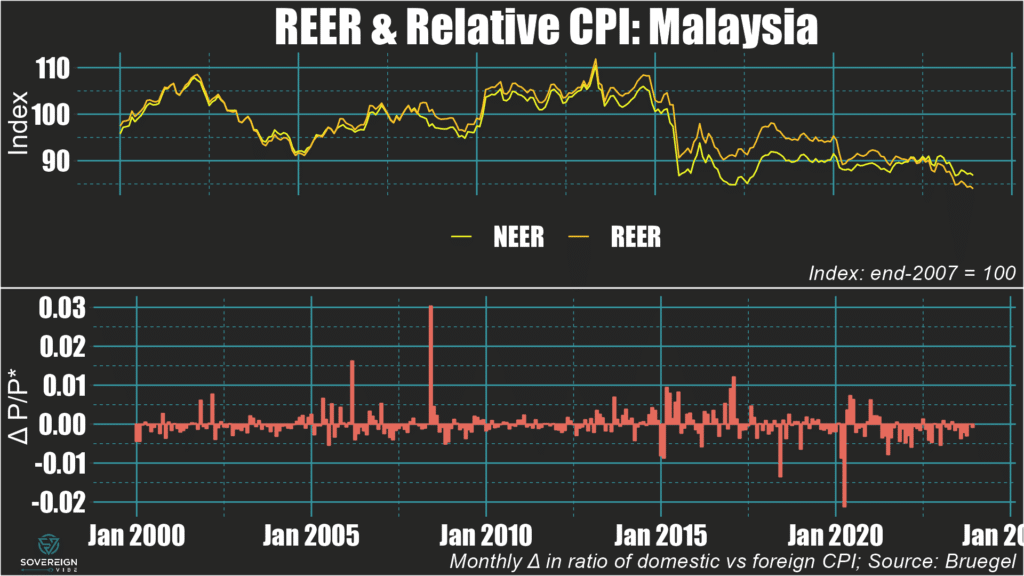
🇵🇭 Philippines: The peso is one of the few currencies in this selection of EM Asian countries to have experienced a real appreciation in 2023, alongside the Korean won and Singaporean dollar. This modest real appreciation was driven by nominal strengthening and a positive inflation differential.
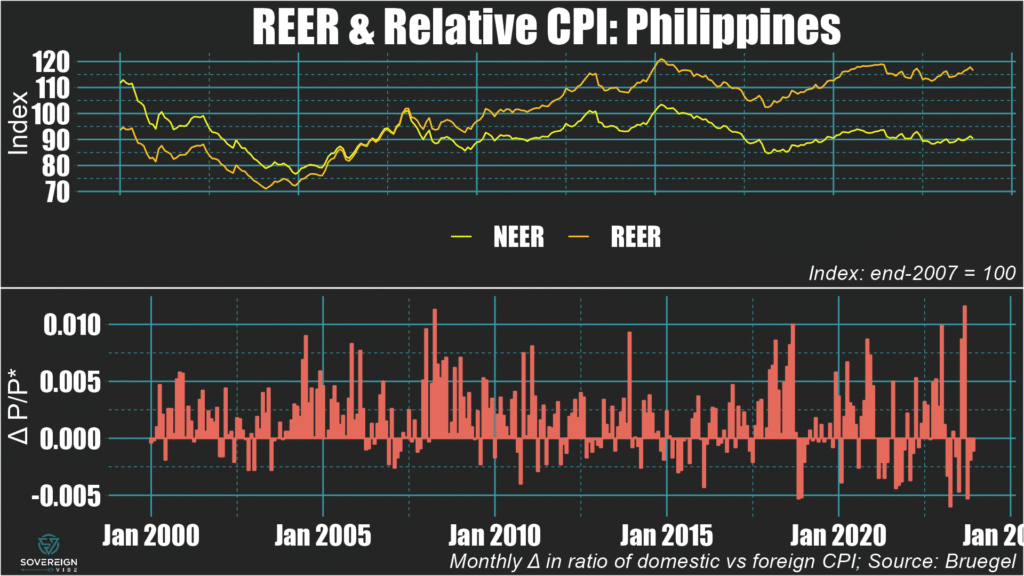
🇹🇭 Thailand: The baht weakened very modestly in real terms in 2023, mostly as a result of a negative inflation differential, while trading flat in nominal terms.
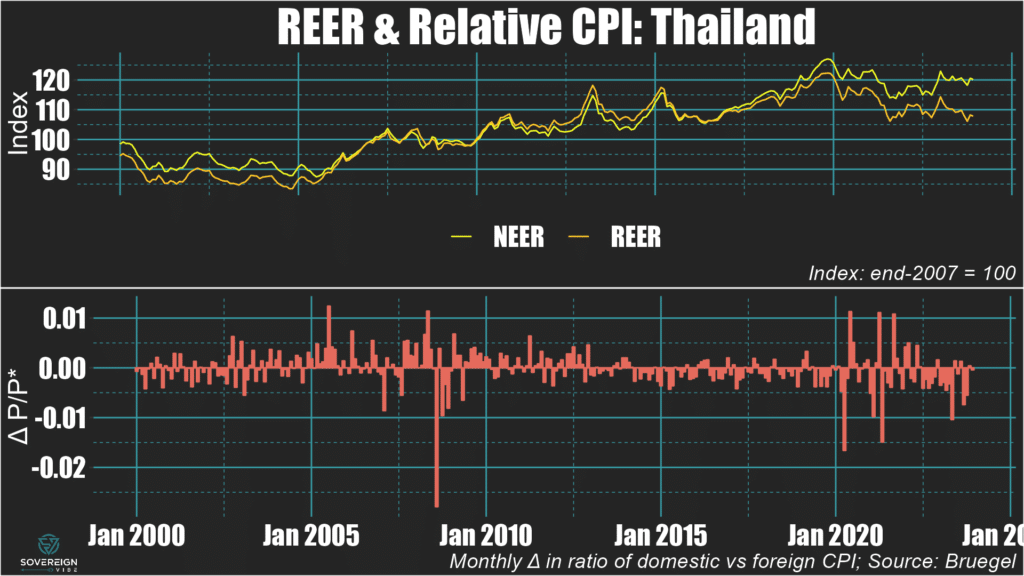
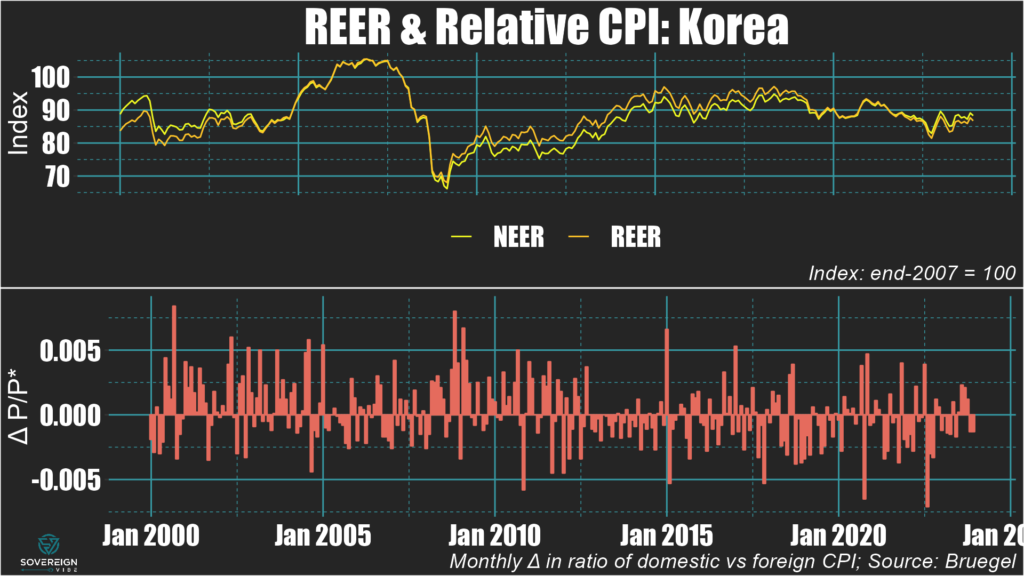
🇰🇷 South Korea: The won’s real exchange rate strengthened slightly in 2023, mirroring the nominal dynamic, with any inflation differential with trading partners close to zero.
Fair Value REERs

In EM Asia, Singapore, the Philippines, Korea, and Thailand appear most overvalued.
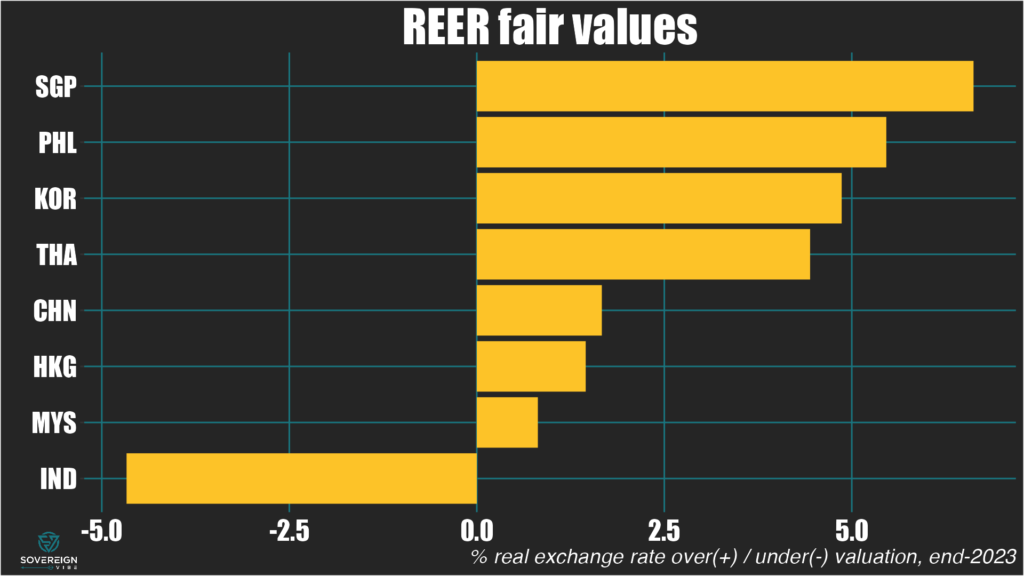
China, Hong Kong, and Malaysia are also in positive territory. However, China’s current account is likely much larger than reported, suggesting that the yuan is almost certainly undervalued.

In contrast, the Indian rupee appears to be about 5% below fair value.

The sample of countries will be expanded in further updates of this analysis.

Underlying & Equilibrium CABs

The chart below shows actual, underlying, and equilibrium current account balances. When the underlying CAB is below the modeled equilibrium, the currency is overvalued in real terms. The percentage amount of over- or under-valuation of the currency is the percentage of real depreciation or appreciation needed to move the underlying CAB to equilibrium. For example:

  • The Philippines’ underlying CAB is well beneath equilibrium, suggesting overvaluation. The peso would need to depreciate by about 5% in real terms for the underlying CAB to rise to equilibrium level.
  • India’s underlying CAB is above the estimated equilibrium implied by the model, pointing towards undervaluation. The rupee would need to undergo real appreciation of around 5% to decrease the underlying CAB to equilibrium.
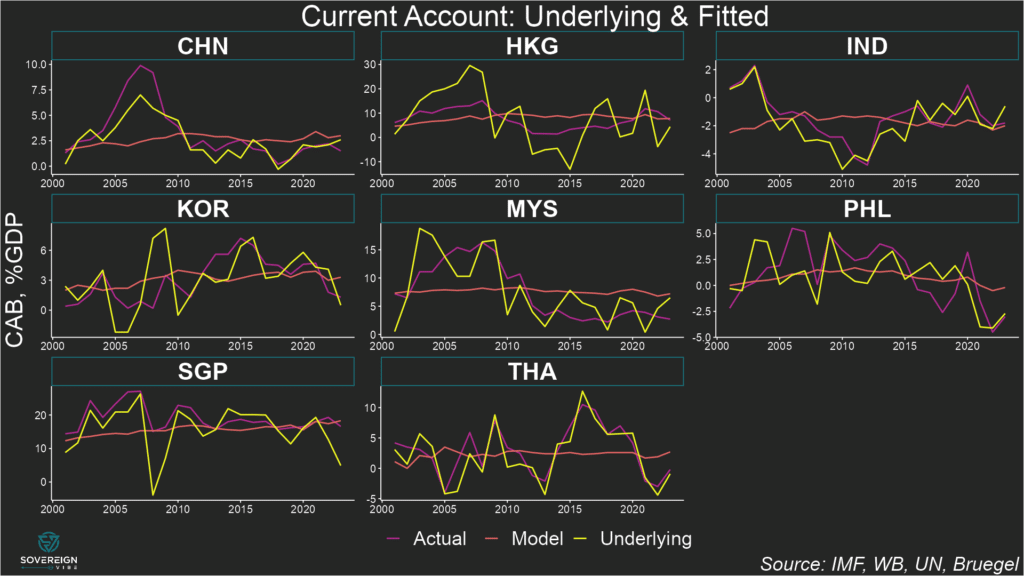
Readers should note that countries with high ratios of imports and exports as a share of GDP have CABs that are more sensitive to REER misalignment.

In other words, seeing where and underlying CAB stands in relation to equilibrium reveals where a currency is over- or under-valued, but not the magnitude of the divergence from fair value.

Categories
Macro

Fair value exchange rates in LatAm

  • FX fair value estimates for 13 economies across LatAm at end-2023 underscore the idiosyncrasies of recent current account dynamics in the region…
  • …while also highlighting V- and L-shape nominal performance against USD since the pandemic in several countries,…
  • …even as the inflationary spike in ~2022 continues to abate across the main economies covered below.

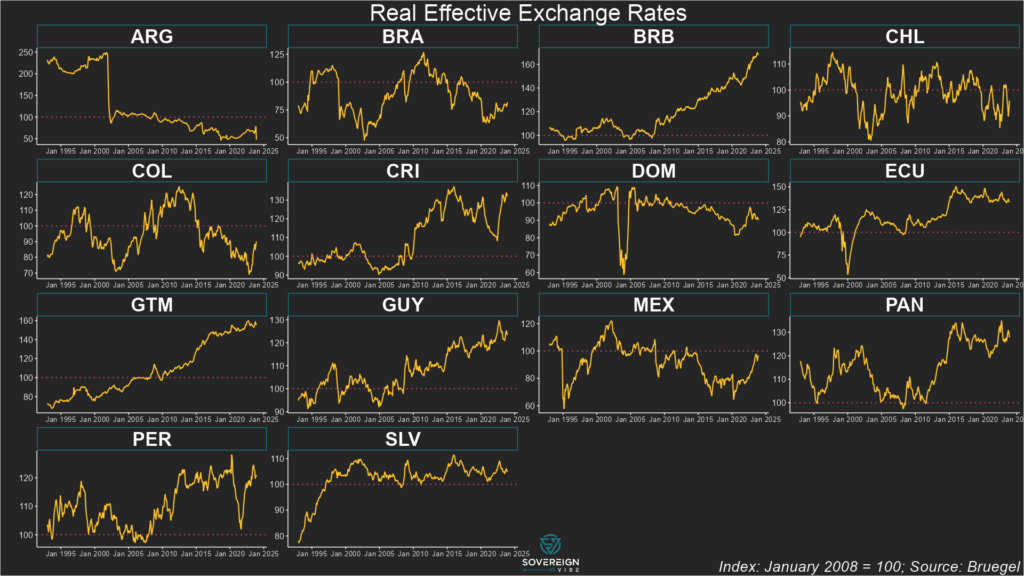
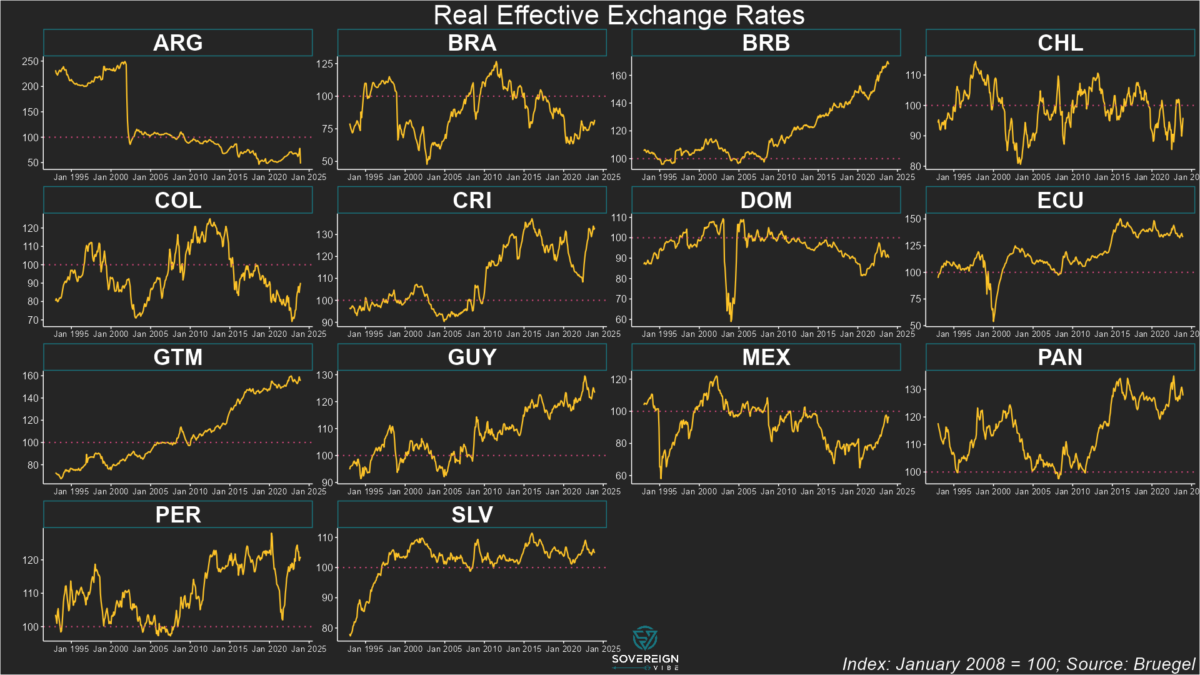
As in other parts of the world, several Latin American economies saw their real exchange rates weaken during the pandemic only to rebound sharply amid the global inflationary shock. This v-shape trajectory of LatAm REERs is most evident in Peru and Costa Rica but is also visible to varying extents in Brazil, Colombia, the Dominican Republic, Mexico, and Panama.

REER trends in LatAm

In nominal terms against the dollar, the main currencies in the region weakened during 2020 before strengthening to varying degrees in the years since. Inflation was generally around the 2% mark in these economies in 2020 before peaking in 2022:

  • 🇲🇽 Mexican peso: after dropping sharply during the early pandemic, the peso had mostly recovered by early 2021 and traded flat until October 2022. Since then, it has strengthened significantly, despite some wobbles circa October 2023. Inflation rose from 2% in 2020 to ~8.5% in 2022 before declining to the 4-5% range in 2023/Q1 2024.
  • 🇧🇷 Brazilian real: weakened significantly in H1 2020 and has traded between flat and very moderate strengthening since. Inflation rose from 2% in 2020 to 12% by early 2022, and has remained mostly in the 4-6% range since late 2022.
  • 🇨🇴 Colombian peso: a sharp drop in March 2020 before almost recovering by the end of the year. Then steady weakening until June 2022, when it dropped sharply, followed by a strong recovery throughout 2023. In early 2020, inflation stood at 4% but declined to sub-2% that year, before beginning to rise in H1 2021, culminating in a peak above 13% in late 2022/early 2023 and since declined to the 8-10% range.
  • 🇨🇱 Chilean peso: came under pressure in March 2020 but only after having experienced a sharper drop in late 2019, so its decline during the pandemic coincided with a pre-existing weakening trend. By May 2021 it had more than recovered the early-pandemic weakness, then steadily weakened to October 2022. Subsequently, it bounced back in mid-2023 before declining again. Inflation hovered in the 2-4% range in 2020 before beginning a long steady rise from 2021 onwards, peaking at 14% in 2022 and declining to circa 4% by end-2023.
  • 🇵🇪 Peruvian sol: a steady, significant decline from early 2019 to September 2021, followed by flat-to-moderate strengthening. Inflation stayed around 2% throughout much of 2020 before rising to around 8.5% in H1 2022, and then beginning to moderate in H1 2023, dropping to below 4% by the end of the year.

Regarding fair values, the broad REER trends described above don’t really shed that much light, as valuations depend on where underlying current account balances stand in relation to equilibrium.

Fair Value REERs

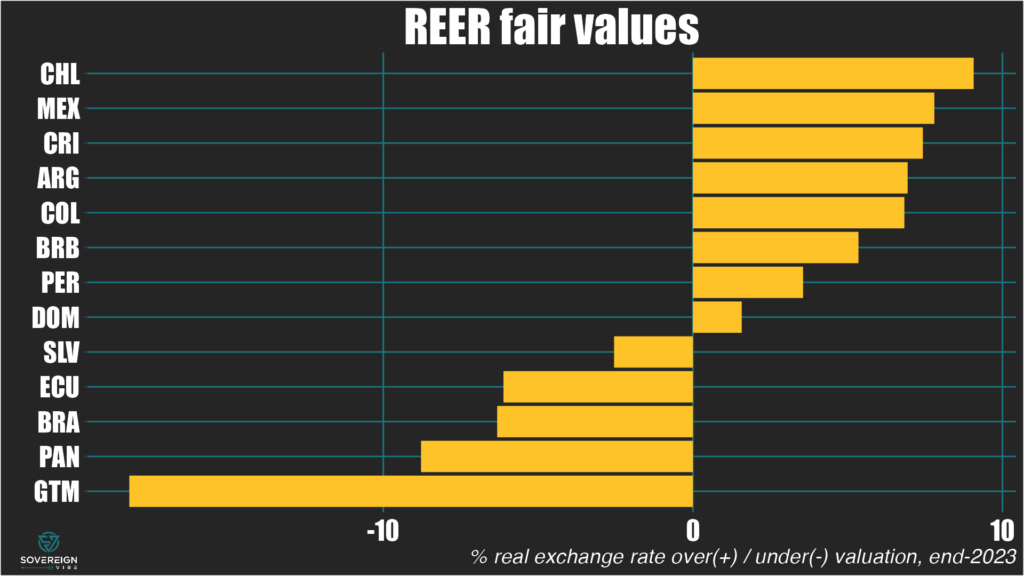
In LatAm, Chile, Mexico, Costa Rica, Argentina, and Colombia appear most overvalued, while Guatemala, Panama, Brazil, and Ecuador seem most undervalued.

In this sample, the Dominican Republic and El Salvador are closest to fair value. Peru’s overvaluation is also relatively small.

Underlying & Equilibrium CABs

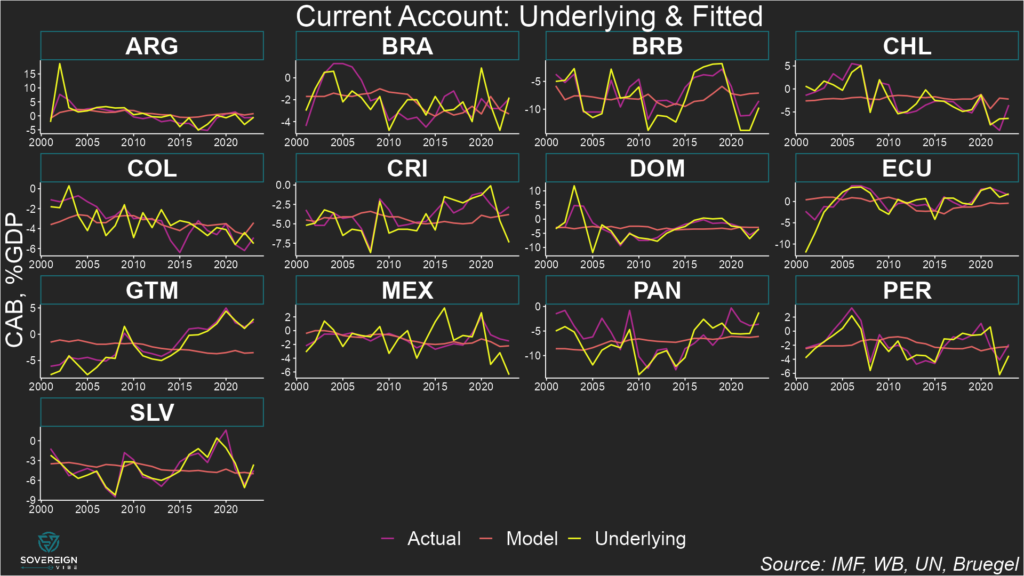
The chart below shows actual, underlying, and equilibrium CABs. When the underlying CAB is below equilibrium, the currency is overvalued in real terms. For example:

  • Chile’s underlying CAB exhibits a significant drop-off, with the headline CAB also being below equilibrium.
  • Mexico’s underlying CA deficit is even deeper in the red at around -6% of GDP, well below equilibrium.

Conversely, when underlying CABs are above estimated equilibria, the currency is undervalued in real terms. For example:

  • Guatemala exhibits a CA surplus of around 2.5% of GDP, about 5 percentage points above its estimated equilibrium.
  • Panama’s CA deficit is above its estimated normal level, which is quite low at around -7% of GDP and explained by some of the unique characteristics of the country’s economy.
  • Brazil has registered some large swings in its underlying CAB in recent years, meaning that the real has alternated between over- and under-valuation.

Readers should note that countries with high ratios of imports and exports as a share of GDP have CABs that are more sensitive to REER misalignment.

In other words, seeing where and underlying CAB stands in relation to equilibrium reveals where a currency is over- or under-valued, but not the magnitude of the divergence from fair value.
Stay tuned for more currency fair values in Asia and beyond.

Categories
Macro

Fair value exchange rates in CEEMEA

  • FX fair value estimates for 13 economies across CEEMEA at end-2023 underscore the impact of the war in Ukraine.
  • Real effective exchange rates spiked in various countries following the successive pandemic-Ukraine shocks…
  • …although Morocco and Croatia appear to be bastions of REER stability in an otherwise volatile group.

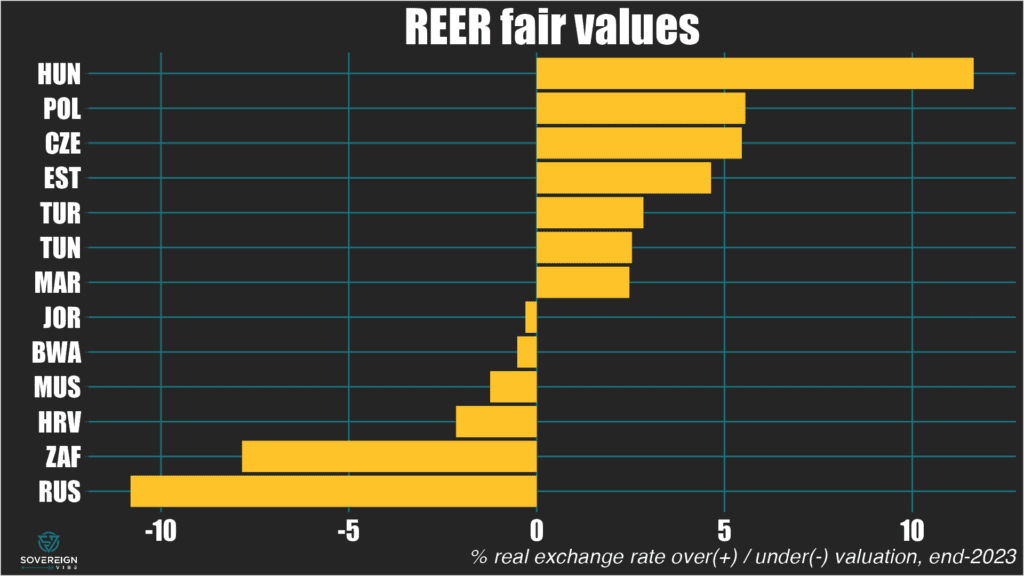
One way to value a currency is to assess the link between current account balances and real effective exchange rates, which merge the nominal exchange rate with the ratio of domestic to trade-weighted foreign prices. The IMF uses a fair value model that compares “equilibrium” to “underlying” CABs, with any difference a result of REER misalignment. FX fair values are presented below.

REER trends in CEEMEA

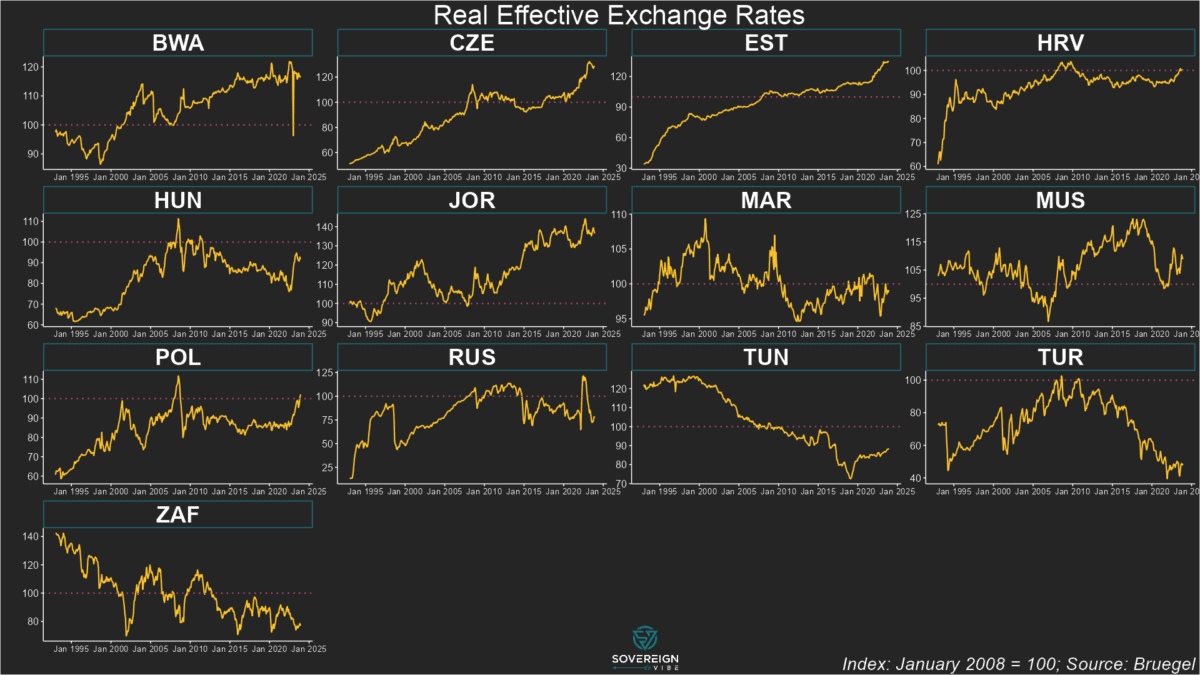
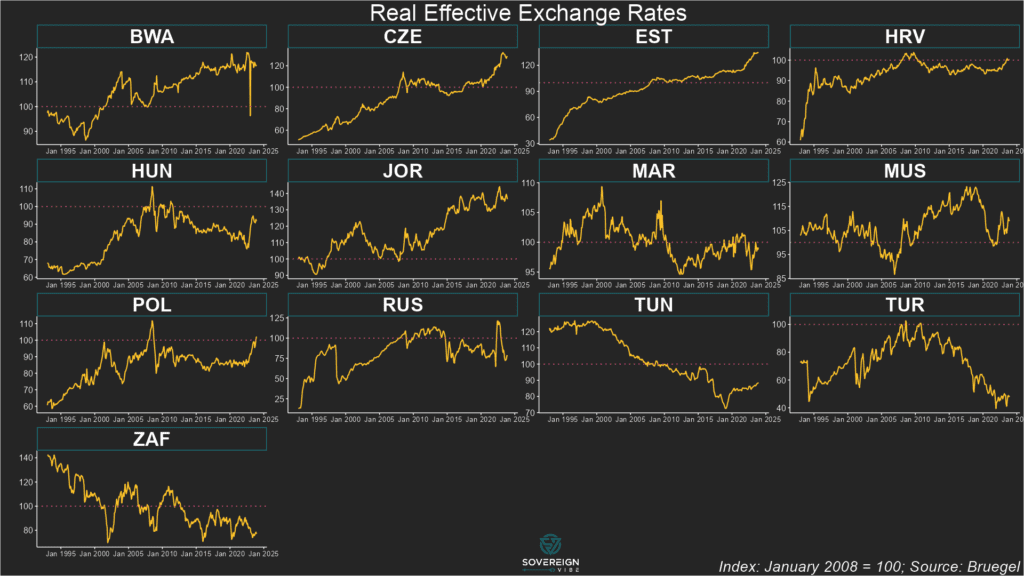
Several economies in Central & Eastern Europe, the Middle East, and Africa have experienced real exchange rate appreciation in the past few years. The dual pandemic-Ukraine inflationary shock since 2021-2022 is in large part responsible for this: annualized inflation remained in double digits in the Czech Republic, Hungary, Poland, Estonia, and Croatia until early- to mid-2023.

Moreover, the Czech koruna, Hungarian forint, and Polish złoty all weakened significantly in nominal terms in 2022, but inflation was so strong that these REERs still rose that year. In 2023, REERs in these countries continued to climb while the koruna traded flat and the forint and złoty registered modest nominal gains.

Russia saw yearly inflation fall from ~11% at the beginning of 2023 to the 2-3% range in Q2 before rising to ~7% by year end, while the ruble weakened significantly, resulting in REER weakening.

South Africa experienced declining inflation and a minor depreciation of the rand in 2023, albeit on the back of significant currency weakening since mid-2021, causing the REER to slide.

Turkey remains an inflationary basket-case, having spent almost all of 2023 near or above 50% in annualized terms, resulting in the lira’s ongoing decline. The net effect has been for its REER to move sideways – but after many years of secular decline.

Turning now to fair values, a number of REERs in CEEMEA exhibit significant over- or under-valuation.

Fair Value REERs

In CEEMEA, Hungary, Poland, and the Czech Republic appear most overvalued, while Russia and South Africa seem most undervalued.

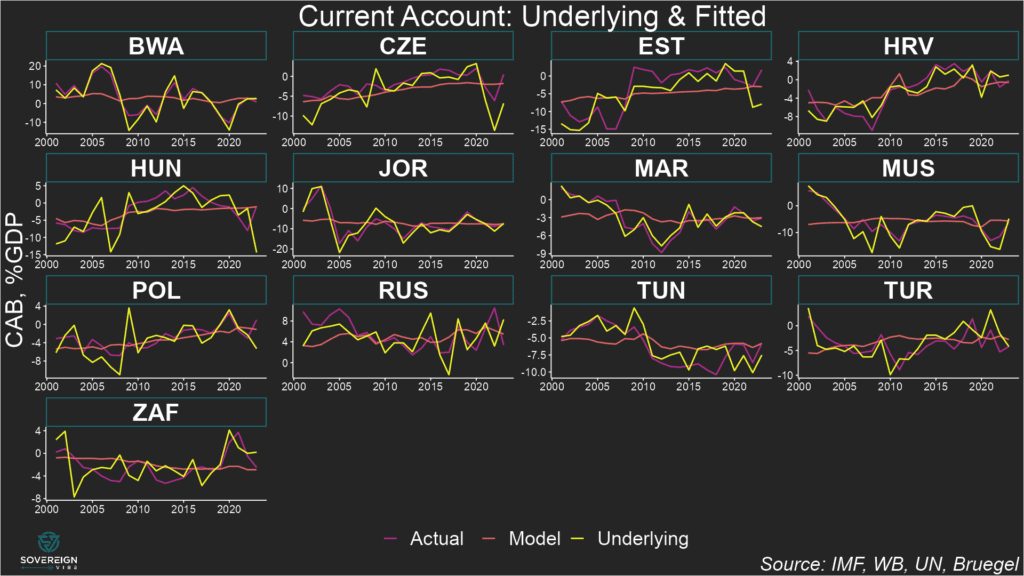
It should come as no surprise that Hungary’s REER is overvalued, on the back of high inflation and (very modest) forint strengthening last year. But the real driver is that Hungary is running a massive underlying current account deficit at -15% GDP (see chart below).

Similarly, it also makes sense for Russia to be undervalued given the weaker ruble and moderating inflation. Its underlying CAB being above its equilibrium CAB confirms this is the case.

The same reasoning applies to South Africa: depreciated rand, lower inflation, and underlying above equilibrium.

Underlying & Equilibrium CABs

When the underlying and equilibrium current account balances are equal, the real effective exchange rate is at fair value.

If the equilibrium CAB is above (below) the underlying CAB, then the REER is over- (under-) valued.

In the chart below, the fitted estimates of current account equilibria are labeled as “model” and are shown alongside actual and underlying CAB readings.

Countries with high ratios of imports and exports as a share of GDP have CABs that are more sensitive to REER misalignment. Turkey and Tunisia provide an example of different sensitivities. In the chart, in 2023 both look overvalued, as equilibrium is above the underlying CABs.

The gap between Turkey’s equilibrium and underlying CAB is smaller than that of Tunisia, yet Turkey’s REER is more overvalued than Tunisia’s, as depicted in the fair values chart above. This is because Turkey’s economy is more open than Tunisia’s, hence REER misalignment has a greater impact on its CAB.