Behold the dashboard for low- and middle-income country external sovereign debt!
After peaking at $188 billion in 2021, for the first time in two decades the stock of low- and middle-income country sovereign debt that China holds declined in 2022. At just under $181 billion, this is still more than the US, France, the UK, Germany, Italy, and Canada combined. Nevertheless, this reversal confirms China’s pullback from its Belt and Road Initiative-driven lending that began in the early 2010s. It is also part of a broader global trend that saw LMICs’ external debt stock dip by $43 billion, from $3.490 trillion in 2021 to $3.447 trillion in 2022. Higher global interest rates are certainly part of the story.
China’s exposure to LMICs is $181 billion.
G7 ex-Japan exposure to LMICs is $161 billion.
There has been no shortage of coverage in recent years on Chinese lenders holding off on new loans to emerging and developing economies. Indeed, Beijing has been reconsidering its Belt and Road Initiative even as its sovereign lenders grapple with the consequences of having such large exposures to EMDEs for the first time. Chief among these of course have been the debt restructurings of recent years, which have underscored how the preferences of Chinese creditors diverge from those of other lenders.
The sharpest drops in percentage terms came in other private lending, which includes trade finance, and in the bilateral concessional category. While we shouldn’t read too deeply into this, I can’t help but muse that decreasing export credits is consistent with worsening frictions between China and its trading partners. Similarly, the drop in concessional overseas lending shouldn’t come as too much of a surprise in the context of domestic financial strains, as China’s property crisis roils onward.
bn USD
2022
2021
% Δ
$ Δ
Bilateral: Concessional
6.6
7.1
-7.8
-0.6
Bilateral: Non-Concessional
142.3
147.7
-3.6
-5.4
Private: Commercial Banks
29.1
30.1
-3.2
-1.0
Private: Other (incl. ECAs)
2.8
3.1
-10.3
-0.3
Total
180.8
188.0
-3.8
-7.2
Chinese lending to lower and middle income sovereign borrowers
Among LMICs, low-income countries are already feeling quite the pinch at China’s relative withdrawal. Chinese exposure to LICs has dropped by a full percentage point of GDP in just the space of a couple years. This is equivalent to a roughly 25% decline relative to output, as Chinese-held LIC debt has decreased from ~4% to ~3% of GDP since 2020.
Geographically, the outgoing Chinese tide is also affecting Africa. In 2022, China held less than $80 billion of African external debt, the lowest reading since 2018. While Sub-Saharan external debt actually increased in 2022, the pace has slowed compared to previous years. This reflects the lower exposure and significant weight of Chinese creditors, as they account for 1/6th of the $480 billion in global holdings of African external debt.
The World Bank’s International Debt Statistics are one of the top resources in the sovereign debt space. The data is released with about a year’s lag, meaning that full year data is currently only available through the end of 2022. But, as you can see, it’s such fertile analytical ground. So feel free to use this dashboard for your own purposes. Also available here.
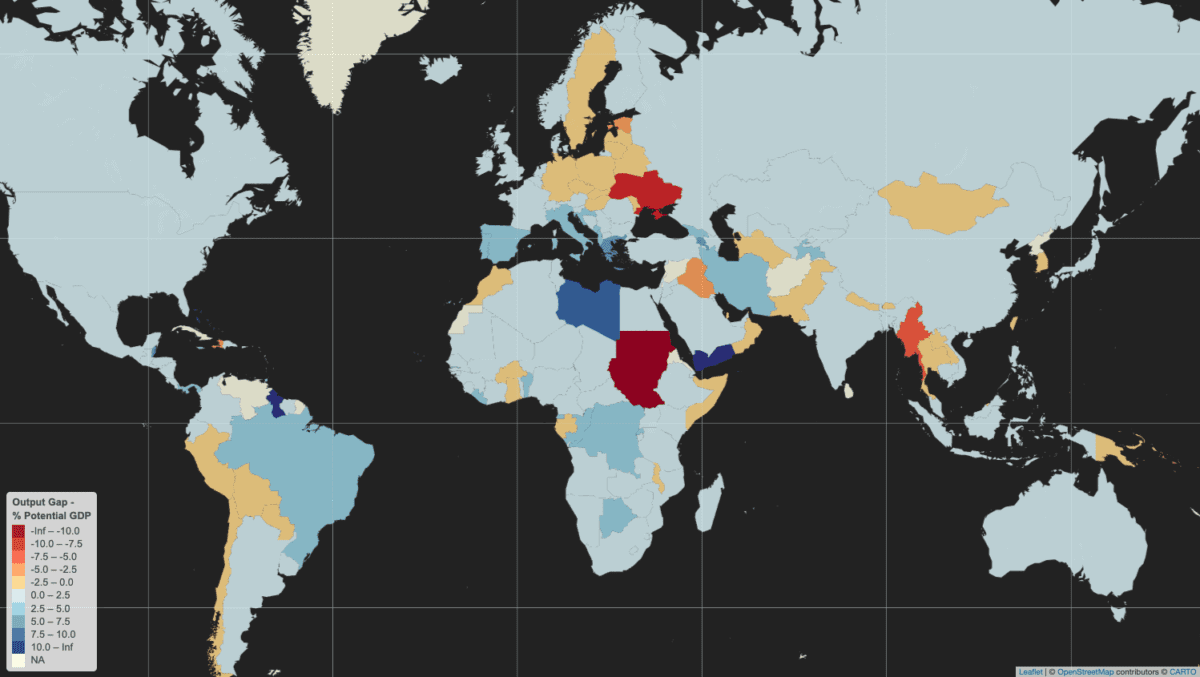
Building on recent work on how to measure deviations of actual GDP from potential GDP, known as an output gap, I’m pleased to reveal a world map of results for 2023. Remember that an output gap is positive when actual GDP is above potential – or trend – and negative when it is below. In the map below, countries in blue have positive output gaps in 2023, while those in orange and red are negative.
While most countries are exhibiting above-trend GDP growth, there are some noteworthy pockets of below-trend output. Chief among these is a large negative output gap in Ukraine, clearly related to the ongoing war with Russia, and which also appears to have infected several of its neighbors in north-eastern and north-central Europe.
Other countries with active conflicts or security-related concerns also seem to be well below potential: Sudan, Myanmar, Haiti, and Iraq.
There are also some clusters of negative gaps in various regions: Latin America (Peru, Bolivia, Paraguay, and Chile), South/Southeast Asia (Pakistan, Nepal, Bhutan, Myanmar, Thailand, Laos), and West-Central Africa (Ghana, Burkina Faso, Gabon).
As for the positive output gaps around the world, these are mostly in the range of 0-2.5% of potential GDP. Much of southern Europe is above this level: Portugal, Spain, Italy, Croatia, Montenegro, Albania, Greece. Farther east, Georgia, Armenia, Iran, and Tajikistan have also recorded above-trend output beyond 2.5%. Brazil and some parts of Africa (Libya, Republic of Congo, Democratic Republic of Congo, Botswana, Benin, and Liberia).
The countries with the largest positive output gaps are in darkest blue: Guyana, Yemen, and Libya. The latter two have of course experienced significant conflicts over the past decade, suggesting that actual GDP is now well above trend as a result of those previous shocks. High positive output gaps can also be a symptom of economic overheating.
Note that data for 2023 is absent for some countries in the map because the IMF did not provide actual GDP estimates for this year in its October 2023 World Economic Outlook. These include Sri Lanka, Afghanistan, Syria, Venezuela, and Cuba. Given high economic uncertainty and/or the absence of reliable data from these countries, fair enough.
Trend GDP: a visual primer
So far in my writing about output gaps I haven’t made any visual presentations of what real and potential GDP look like. As explained previously, measuring potential GDP is complicated and data-intensive, so economists often use a shortcut: deriving a moving average of actual GDP readings as a proxy for potential GDP. The approach I have taken is known as Hodrick-Prescott filtering.
As a result of the previously-noted pitfalls of using moving averages to measure potential GDP, I refer to the term of “trend” rather than “potential” GDP. As for “actual” GDP, this is data in national currency units using constant prices, meaning that it is real – and not nominal – GDP.
The charts below provide examples actual and trend GDP. I’ve selected these countries because they are ongoing sovereign debt restructuring cases of interest, even if I only present them here for demonstrating how actual / real and trend / potential GDP relate to each other and output gaps:
Output Gap = (Real GDP - Potential GDP) / Potential GDP * 100
Sri Lanka is perhaps the most interesting case, even if the data is only through 2022: a sizable positive output gap – indicating potential overheating in the economy – preceded a sharp drop in GDP, leading to a negative output gap. Also currently in negative territory, Ghana’s GDP exhibits some of the same behavior, albeit with less volatility.
Zambia sustained a positive output gap throughout most of the 2010s, until an economic contraction in 2020 led it into negative territory, though the gap turned positive again in 2023. Once one of the world’s fastest growing economies, Ethiopia’s economic growth has also been remarkably stable, despite the recent Tigray conflict. This makes for a more “boring” chart but is a credit to the country’s economy, with the output gap in marginally positive territory.
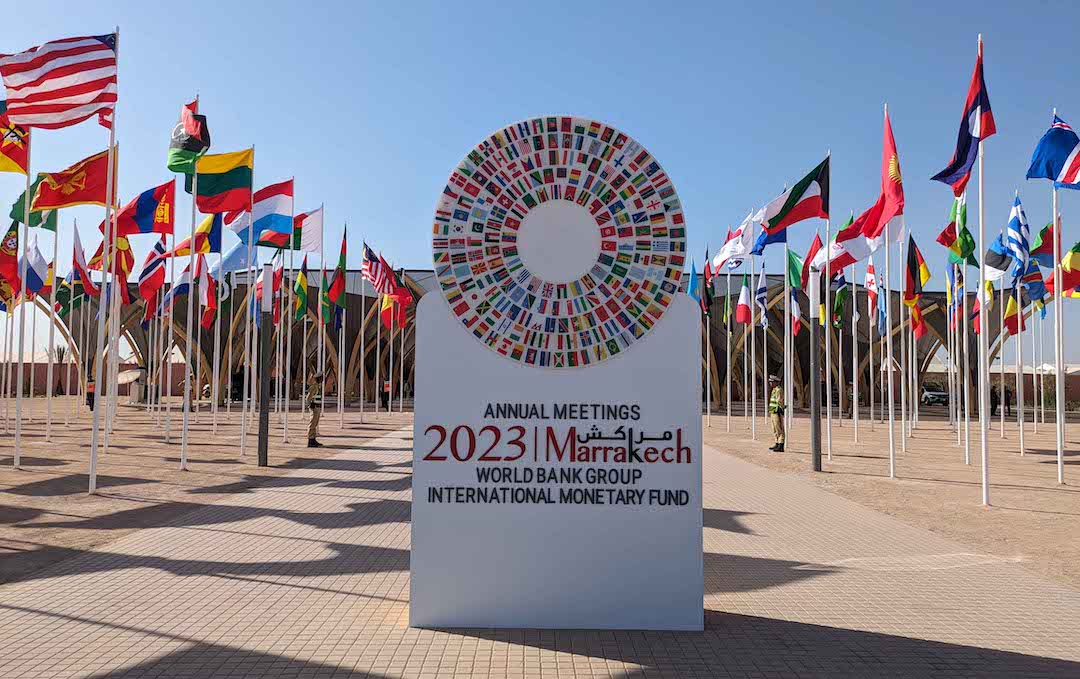
The World Bank Group-International Monetary Fund Annual Meetings drew to a close in Marrakech this past weekend, the first time these events have been held in Africa since the 1973 edition in Nairobi. While the Bank-Fund leadership expressed their usual endorsement of international cooperation and optimism for the future, this year’s agenda also explicitly aimed to address geopolitical fragmentation and fully acknowledged heightened threats to the goals of eradicating poverty; bolstering sustainable, inclusive growth; and preserving macroeconomic stability.
The main problem at this year’s annuals wasn’t a new one and goes by many names: geopolitical competition, fragmentation, deglobalization, trade frictions, or decoupling. A whole host of challenges to multilateral financing efforts stem from the political obstacles to international cooperation that have emerged over the past decade, with the 2007-2009 Global Financial Crisis marking the end of America’s “unipolar moment” and ushering in a new, more competitive era. The prospects for a new capital increase for multilateral development banks, innovative hybrid financing solutions to boost World Bank lending, and sovereign debt restructuring processes are all suffering from the fractured backdrop.
IMF Global Policy Agenda
The IMF’s policy priorities are a response to the main macroeconomic challenges in today’s global economy:
tame inflation
ensure financial stability
restore fiscal room
boost medium-term growth
Indeed, inflation has not yet reverted to central bank targets in many countries, while the rapid rise in interest rates in the past few years have strained parts of the US banking system. At the same time, expansionary fiscal policies have pushed up yields on government debt in various countries, with the return of bond vigilantes evident in the US in 2023. The prospect of higher fiscal deficits can also sometimes undermine financial stability, as exemplified by the UK mini-budget straining pension schemes in September 2022. Tighter fiscal policy will be necessary in many countries to guard against future shocks, while appropriate reforms are also widely-needed to revive the dimmed outlook of medium-term growth.
In parallel with the macroeconomic policy priorities, the Fund is pursuing complementary objectives. The IMF launched, with the government of Morocco, the Marrakech Principles for Global Cooperation, which include reinvigorating inclusive and sustainable growth; building resilience; supporting transformational reforms; and strengthening and modernizing global cooperation. These principles are a welcome attempt to stem the tide of global divergences, even if they are unlikely to meet with much success in the short term. In a similar vein, the IMF has attracted more funding for the interest-free Poverty Reduction and Growth Trust and for the climate change-focused Resilience and Sustainability Trust.
Of note, the IMFC Chair committed to concluding the 16th General Review of quotas by December 2023, in light of agreement on a significant increase of quotas this year. Crucially, there seems to be support for quota realignment by June 2025 to reflect current economic realities, including through an updated quota formula. The IMFC has also called for the creation of a third chair on the IMF Executive Board for Sub-Saharan Africa, in order to improve the continent’s representation.
Yet the IMF has not been able to deliver more in the way of impactful policy successes. One potentially high-impact policy area would be finding a solution for re-allocating SDR usage from the wealthy countries that don’t need them to the poorer countries that do. A further work-stream with outsized effects would be to do more to strengthen the Global Financial Safety Net, which includes the IMF’s toolkit, bilateral swap arrangements, regional financial arrangements, and international reserves – a tall order in the current environment.
Global Sovereign Debt Roundtable
The official sector has achieved a modicum of progress on improving the sovereign debt restructuring architecture in recent months. Probably of most importance to private creditors is improved information-sharing during restructurings, with new possibilities for private lenders to access debt sustainability analyses and related elements at the same time as official creditors, under certain conditions. The Fund has highlighted the increasing speed from staff-level approval to Board approval, from 11 months in Chad in 2022, to 9 in Zambia, 6 in Sri Lanka, and 5 in Ghana most recently, while recognizing that this is still above the 2-3 month average in the past.
The IMF maintains that external public debt strains are not currently as high as they were in the 1990s, even considering the existence of larger local debt markets, which has led to some observers wondering if there is a sense of complacency about pending risks in low-income countries. The IMFC welcomed progress in Zambia, Sri Lanka, and Suriname but called for more results in Ghana, Ethiopia, and Malawi, while also calling for stronger creditor coordination for sovereign debt restructurings occurring outside the Common Framework.
One of the main pieces of news to come out of the meetings was that Zambia’s finance ministry and its official creditor committee signed a memorandum of understanding, thus formalizing the agreement reached in June, and paving the way for Zambia to seek comparable treatment from its commercial creditors. It was also revealed that Kenya may be seeking exceptional access to IMF support ahead of a $2 billion bond maturing in June 2024.
There are some other minor new features in the sovereign restructuring framework, regarding cutoff dates (no later than staff-level agreement), state-contingent debt instruments (which shouldn’t be the norm), and the appropriate approaches to domestic debt (case-by-case) and SOE debt. Other areas remain contentious among the various creditor categories, such as appropriate discount rates to be used for NPV calculations for comparability of treatment. There is also no consensus on the treatment of arrears and on debt service suspensions during negotiations.
Show me the money: capital increases for MDBs?
Despite the ongoing efforts of senior staff to convince donor countries to provide more resources for development, the World Bank Group’s ambitions will continue to lack requisite firepower. The cause is an absence of political will in most of the G7 countries to make sufficient financial commitments to development, as evidenced by a succession of broken Western promises. To be sure, some efforts are under way, such as Japan’s pledge to significantly raise its contribution to the IMF’s zero-interest loan tool, the Poverty Reduction and Growth Trust. For its part, the US may transfer $2 billion in additional funding to the World Bank Group this year, though this is a far cry from the scale that is needed.
Additional annual financing required to meet the United Nations’ Sustainable Development Goals stands at around $3 trillion. The G20’s Capital Adequacy Review framework suggests that a general capital increase for the multilateral bank system, including the IBRD, could unlock $200 billion in annual lending, with a further $80 billion annually from balance sheet optimization (e.g. callable and hybrid capital). The Center of Global Development suggests that the international development finance system should boost its annual financing by $500 billion by 2030, with multilateral development banks providing $260 billion and national development finance institutions delivering the remainder. Private capital ought to match that half-trillion increase, for a combined public-private total of $1 trillion.
Yet these figures still fall well short of the additional $3 trillion needed annually. By the CGD’s calculations, each dollar of new equity in MDBs can be leveraged for $15 of external sustainable investment financing, of which $7 in direct MDB lending and $8 in private capital. Assuming that private finance can be crowded in to such a degree is likely overly optimistic, as the CGD’s own figures indicate that MDBs currently mobilize only 60 cents for each dollar lent. Even so, public and private stakeholders will have to come up with financing solutions to achieve the SDGs, and this should be possible with enough political will: just look at the over $100 billion raised for Ukraine.
The World Bank’s Evolution Roadmap
The World Bank Group’s recently-appointed president, Ajay Banga, has laid out a roadmap to enhance the organization’s effectiveness. More efficient balance sheet management should unleash $157 billion in additional lending over 10 years, while preserving the Bank’s AAA rating. These measures include increasing the loan to equity ratio, launching a hybrid capital instrument, and creating a portfolio guarantee mechanism. Similarly, management is also exploring solutions using callable capital and SDRs. An elegant approach to channeling some of 2021’s SDR 650 billion windfall could be to have the Bank issue SDR bonds, to be purchased by national central banks.
A number of other changes are in the works under Banga. These include setting up a Global Public Goods Fund to grow concessional resources by attracting funding from governments and philanthropies, exploring maturities of up to 40 years for social and human capital investments, and exploring energy transition solutions. More importantly, efficiency gains are at the heart of the new strategy. There is an objective to slash project review and approval times by a third by simplifying procedures, while partnerships with other MDBs are already being pursued more actively so as to amplify impact. Similarly, Banga’s team plans on scaling knowledge-sharing in order to more easily share impactful solutions, and a private sector investment lab has already been set up to galvanize private financing.
Banga’s plans to streamline processes seem like a requisite pre-condition for convincing donor countries to increase the Bank’s share capital, though even if his team can deliver, any new equity is far from guaranteed. Early signs of the new president’s first few months in the role have demonstrated his dynamism and communication skills, and future success in reforming the institution’s bureaucracy, while likely challenging to achieve, could yield significant development benefits. However, his team is reportedly difficult to approach internally, which could potentially delay progress.
The first web application as part of Sovereign Vibe’s DataHub disaggregates the World Bank’s International Debt Statistics’ outstanding debt stock data for 68 low-income countries by creditors type: multilateral, bilateral, and private. Further decompositions are provided for the concessional and non-concessional components of multilateral and bilateral lending, and also for private credit by bondholders, banks, and other private lenders.
This first update to the “External Sovereign Debt: DSSI Countries” dashboard adds some helpful new features for users seeking to quickly view and analyze external public and publicly-guaranteed debt stock data. To begin with, the updated app now covers data extending back to 1970, the earliest year available in the WB database. The pilot version only extended coverage back to 2000, given the heavier data burden and the uncertainties around this initial attempt.
Secondly, this new version of the dashboard allows users to view the IDS debt stock data in US dollars, as previously, but now also includes an option to view the readings as a percentage of GDP.
Third, a new category has been created to aggregate all borrowing countries. When opening the application, the “Sovereign borrower(s)” category defaults to “All DSSI,” while the “Creditor(s)” menu defaults to “World” so that users can get a high-level view of all lending (i.e. from the entire world) for all these countries (i.e. all DSSI) at once. This view is presented in the previous post, “Cure worse than the disease,” but was previously unavailable through the dashboard.
Finally, the update enables users to select multiple creditors when viewing a country’s external debt stock. Over two hundred creditor locations and types are specified in the creditor menu, so, for example, a user could choose to look at how much China, France, bondholders, and the World Bank-IBRD have lent to Zambia up until the latest data reading.
Further updates to this dashboard could include allowing users to select multiple borrowers at once. While in practice providing this is currently possible for viewing the debt stock data in US dollars, some back-end work is needed to make aggregating borrowers usable in percentage of GDP. Next steps will include:
Enabling users to select multiple borrowers at once
Expanding coverage to the broader emerging markets universe
Moving beyond external debt stocks and towards associated external sovereign debt flows
Progressing from descriptive data towards analytical outputs
What are your thoughts on this basic dashboard? How do you think it could be improved, and what features would you like to see? Feel free to submit comments in the section below or via the website’s Contact page.
All suggestions for avenues of further research are welcome as Sovereign Vibe progresses from its current pilot phase towards deeper analysis of challenges facing the sovereign debt landscape and the emerging markets complex.
A high-level snapshot of the structure of outstanding external sovereign debt burdens for low-income countries and reflections on the G20’s pandemic-era DSSI policy and its successor, the Common Framework for Debt Treatments beyond the DSSI.
LIC debt burdens
During last month’s IMF-World Bank Spring Meetings, I listened to a discussion on debt crisis resolution between civil society activists and IMF staff. The vastly different frames of reference, language, and motivations on low-income country (LIC) debt playing out were captivating. It is precisely this clash of worlds that the sovereign debt space needs more of as stakeholders search for the best policies to foster inclusive growth and eradicate poverty.
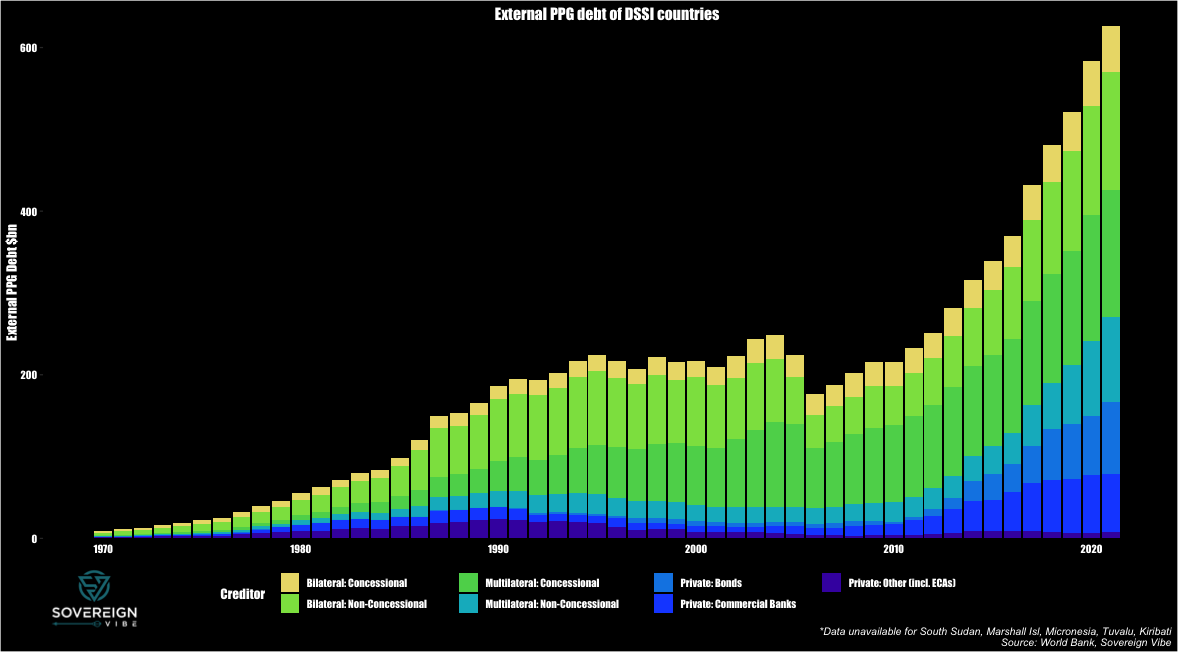
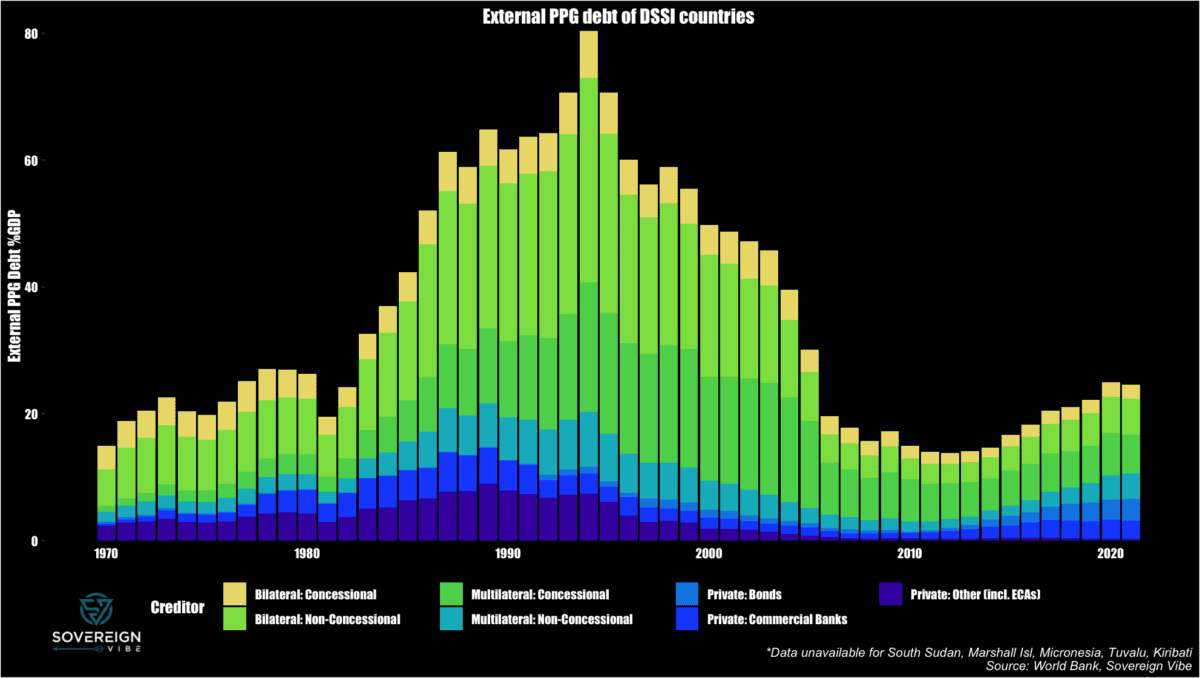
Civil society organizations (CSOs) have a long-standing and well-known position on LIC external sovereign debt: in a nutshell, just cancel it. Indeed, rising external debt burdens in LICs in recent years have fueled more calls for debt forgiveness. Looking at the DSSI-eligible LICs, the rapid increase in external sovereign debt in the 2010s does give pause for concern. While the overall external public and publicly-guaranteed (PPG) debt load hovered around $200 billion throughout the 1990s and 2000s, it surpassed the $600 billion mark in 2021.
Contrast the CSO perspective with IMF staff assertions that external sovereign debt strains in LICs are less severe today than in the past. Needless to say, the CSO representatives were essentially unanimous in taking issue with this position, labeling it as provocative. IMF staff presented a chart resembling the one below, highlighting how external public debt-to-GDP was much heavier previously. In fact, the most acute strains occurred in the mid-1990s. These declined until the late 2000s, partly thanks to the Heavily-Indebted Poor Countries initiative (HIPC) from 1996 and the Multilateral Debt Relief Initiative (MDRI) from 2005.
While today’s external PPG debt ratios are less alarming, the growth of domestic capital markets in many LICs suggests that overall (i.e. domestic plus external) sovereign debt-to-GDP could be too high. Moreover, LIC sovereigns have borrowed more on non-concessional terms over the past decade, pointing to greater interest payment pressures.
The new data above will augment the DSSI dashboard in the Sovereign Vibe DataHub, where users can filter data by borrower and creditor.