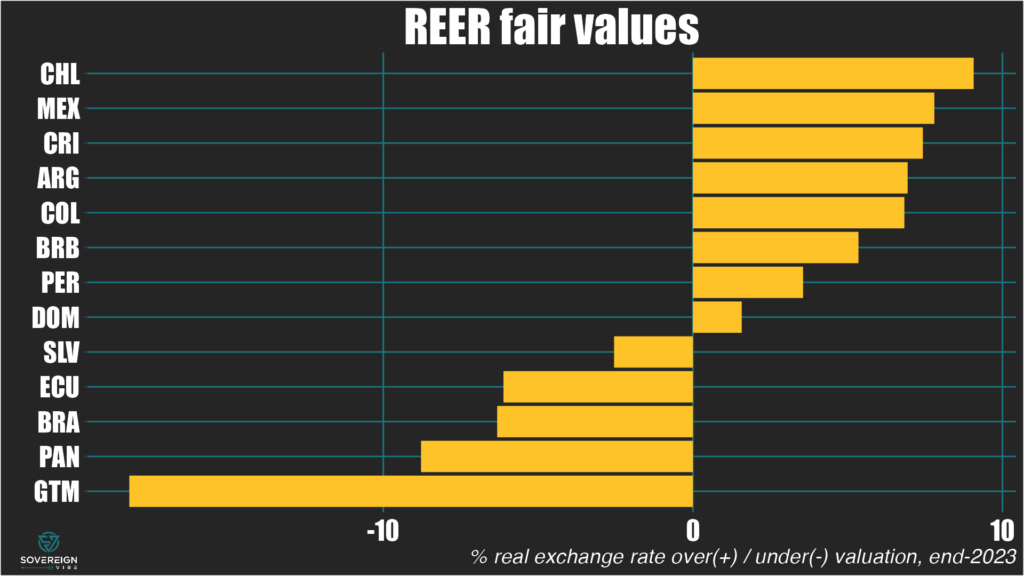
- FX fair value estimates for eight EM Asia economies point to more over- rather than under-valuation across the region…
- …so the real depreciations registered by most of the region’s currencies last year has pushed many (but not all) towards fair value.
- Inflation differentials are now playing a larger role in determining REERs compared to the pre-pandemic era.
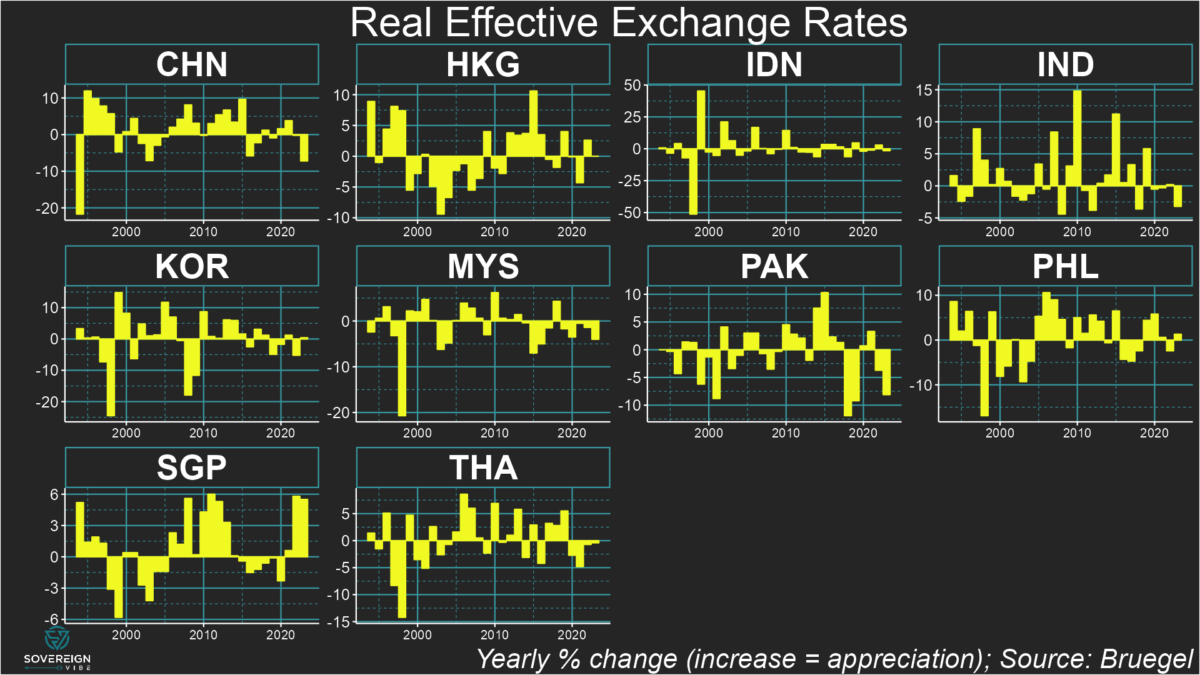
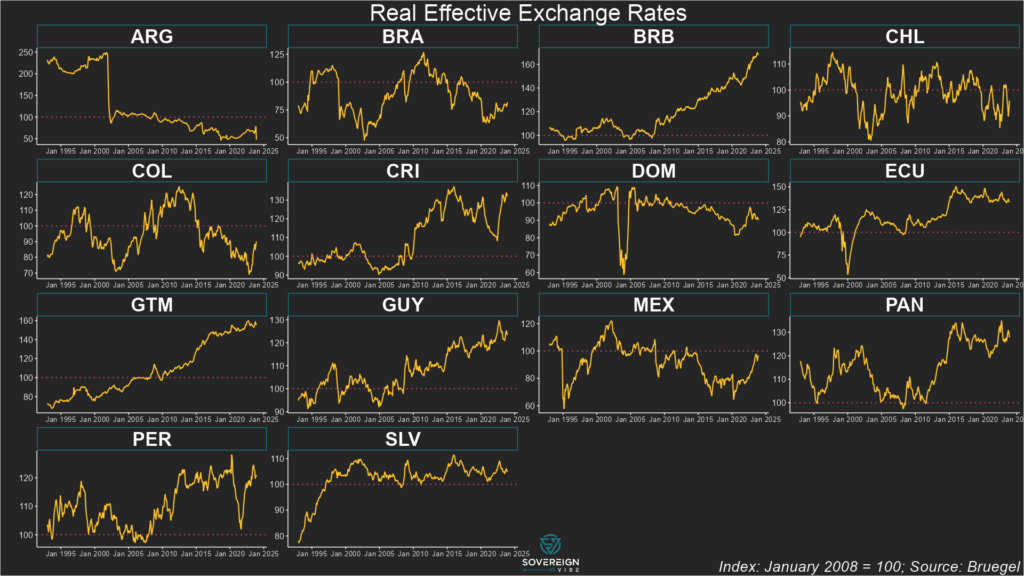
Currencies in emerging markets Asia mostly declined in real terms in 2023. Pakistan registered the sharpest real exchange rate depreciation, though China also weakened significantly on the back of much less inflationary pressure in the country relative to its trading partners.
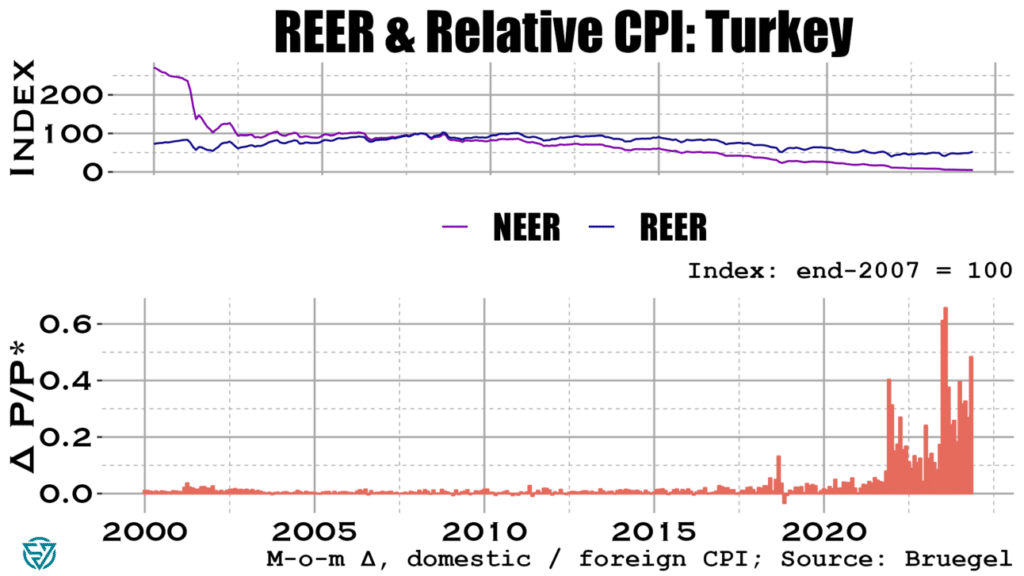
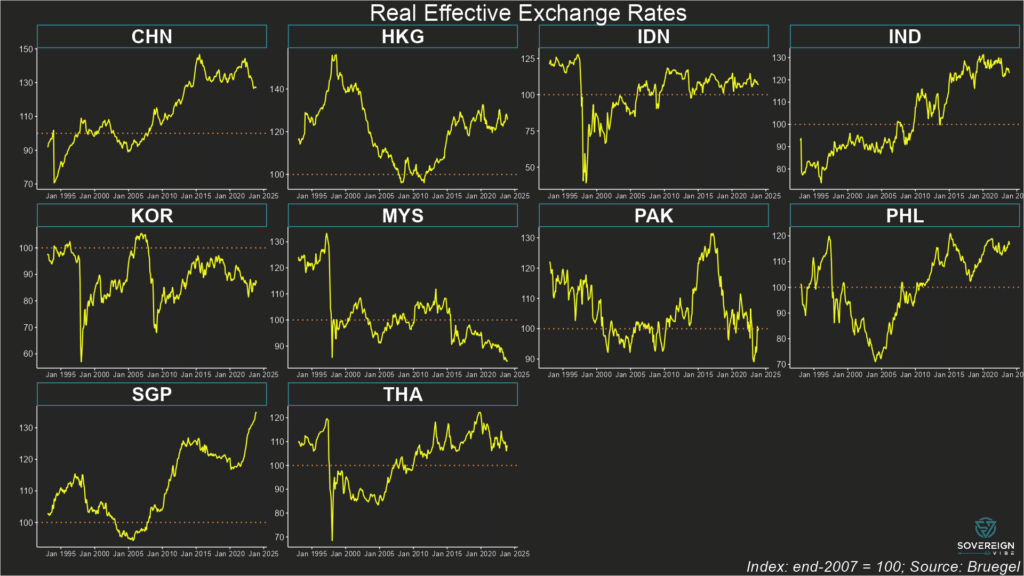
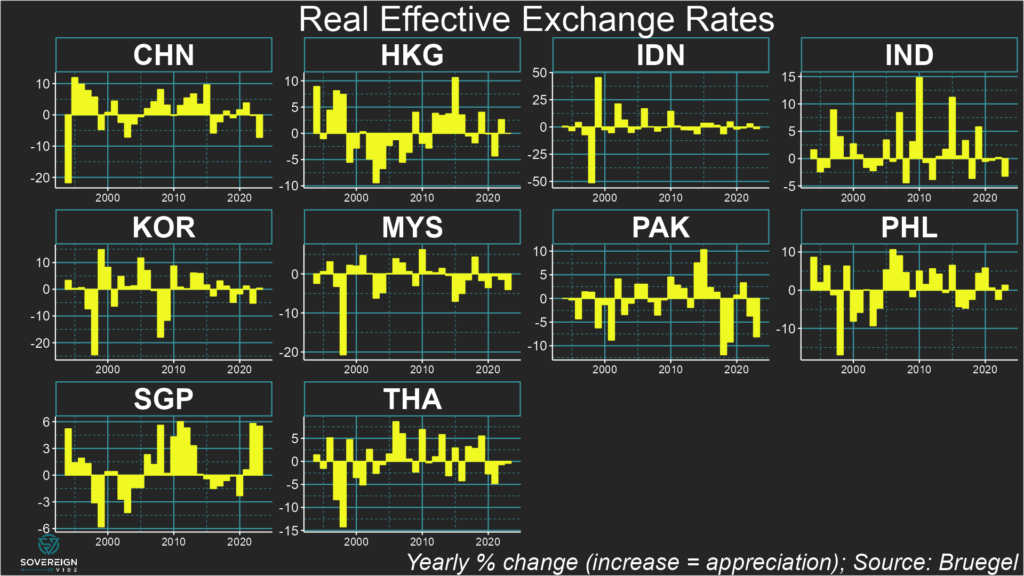
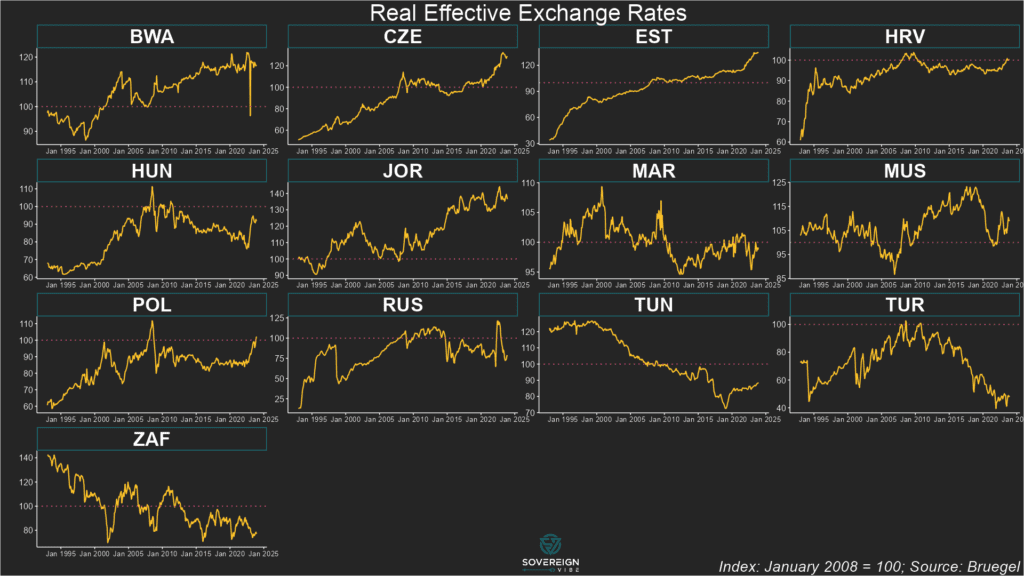
REER trends in EM Asia
Of the eight EM Asia countries covered below, only the Philippine peso and Korean won strengthened in real terms in 2023, though the Singaporean and (possibly) Hong Kong dollars were also in positive territory for the year.
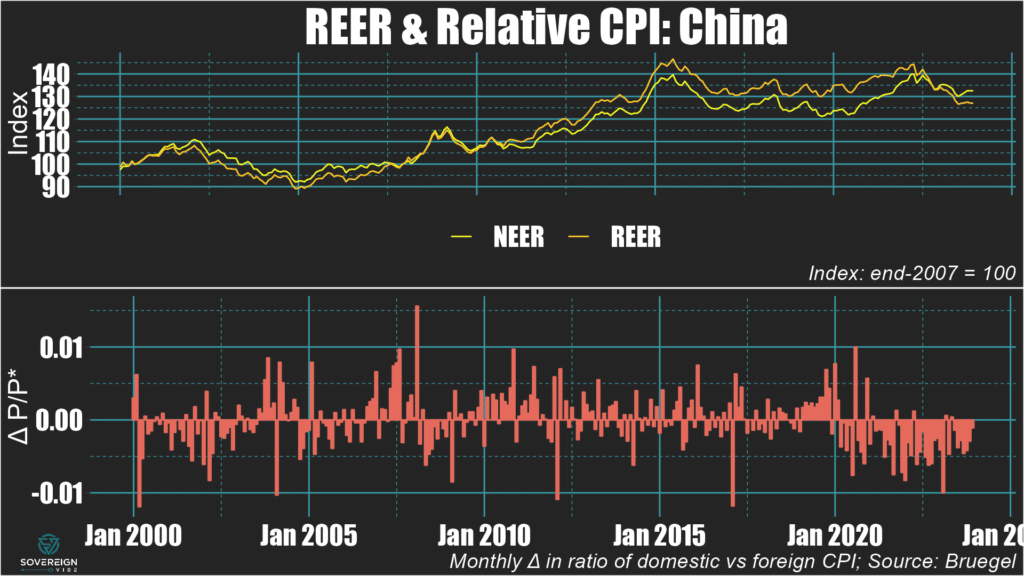
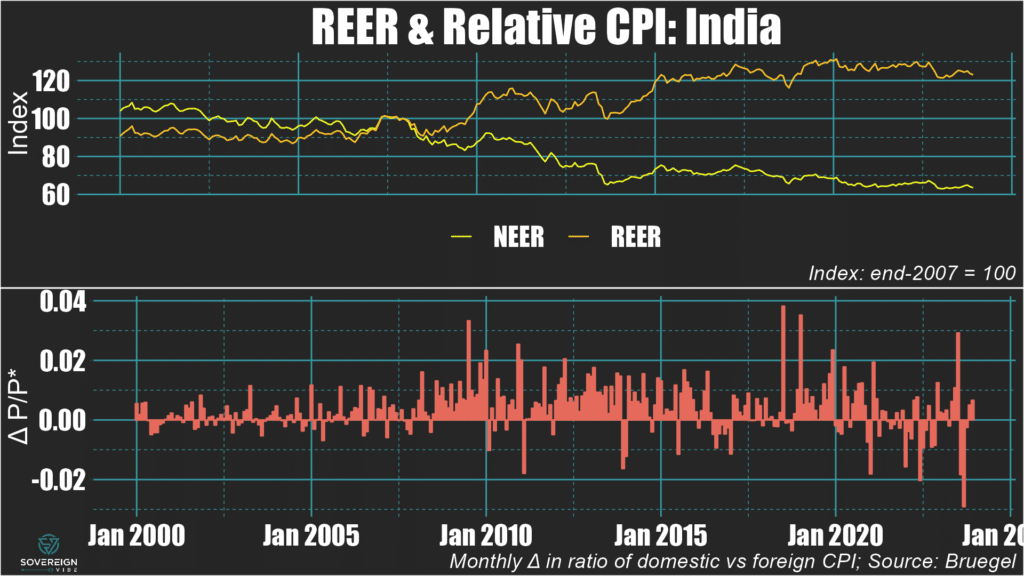
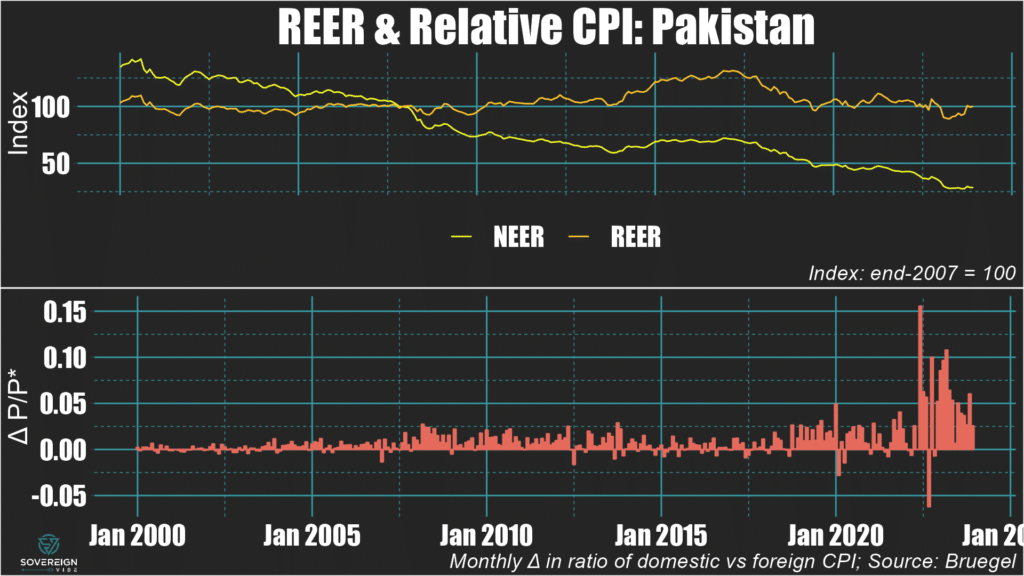
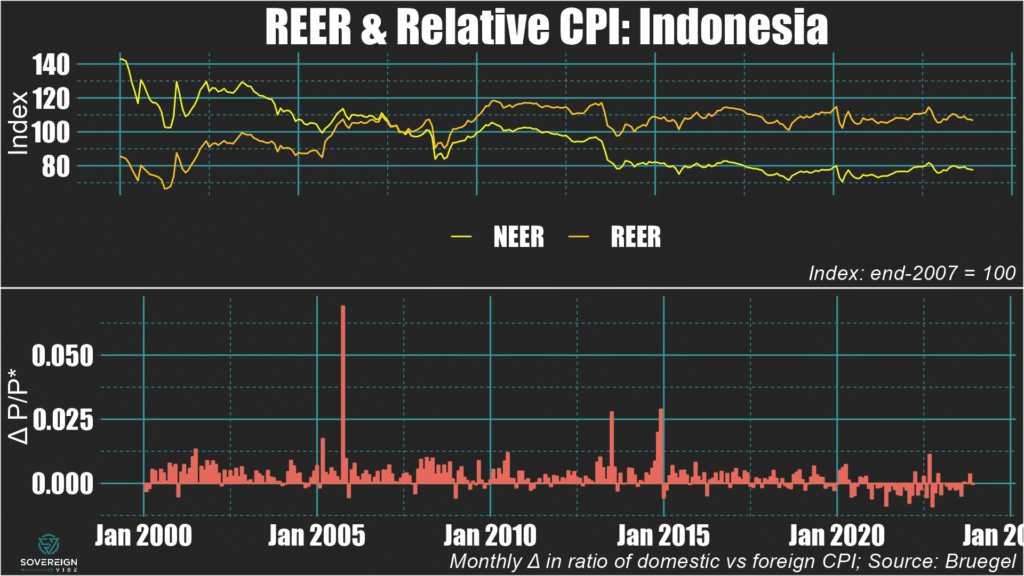
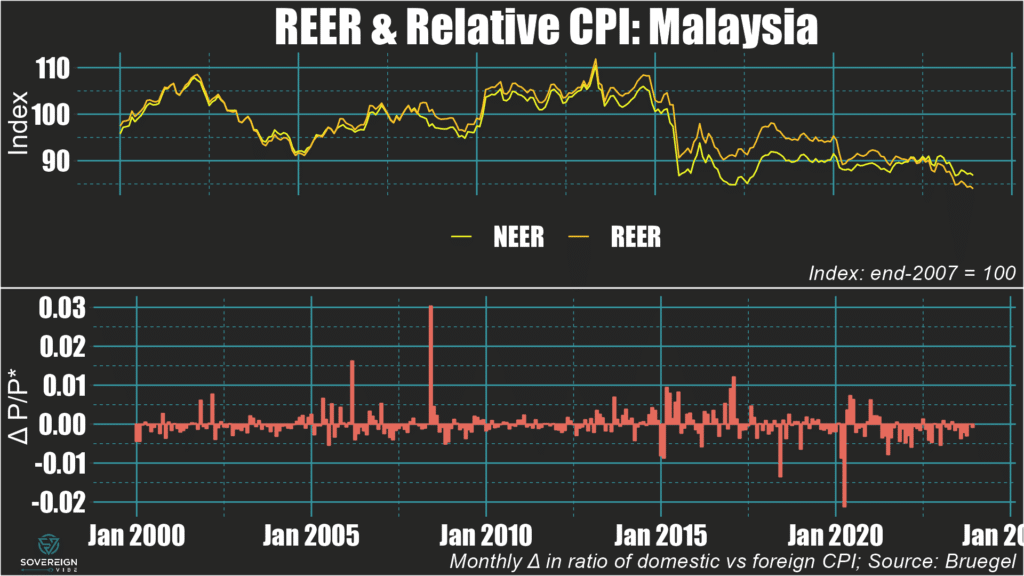
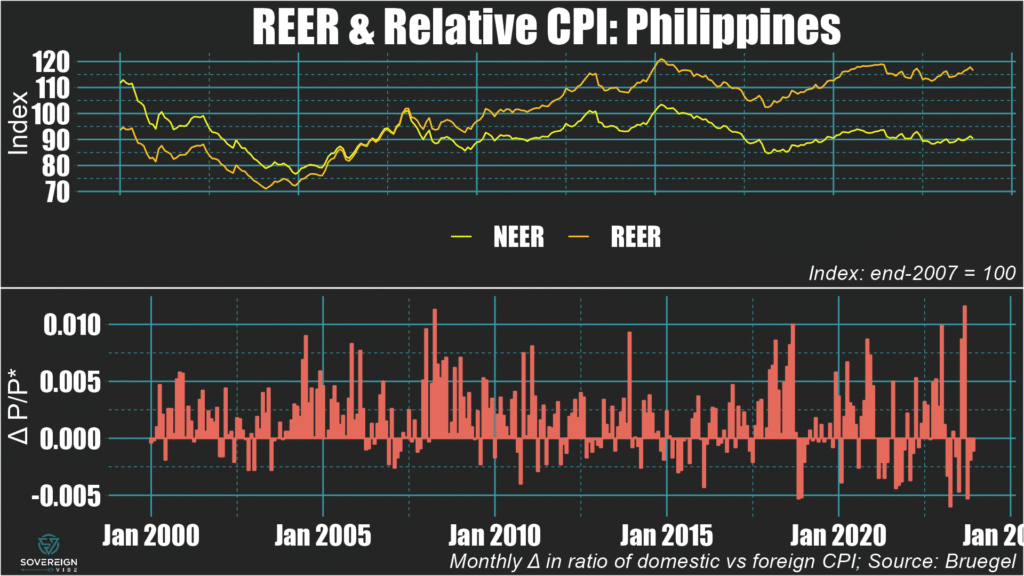
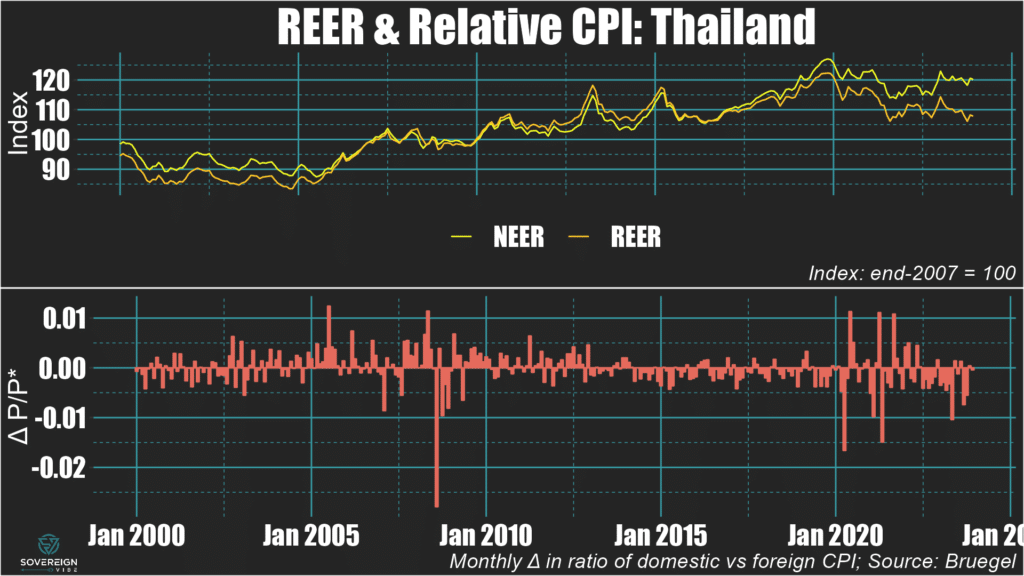
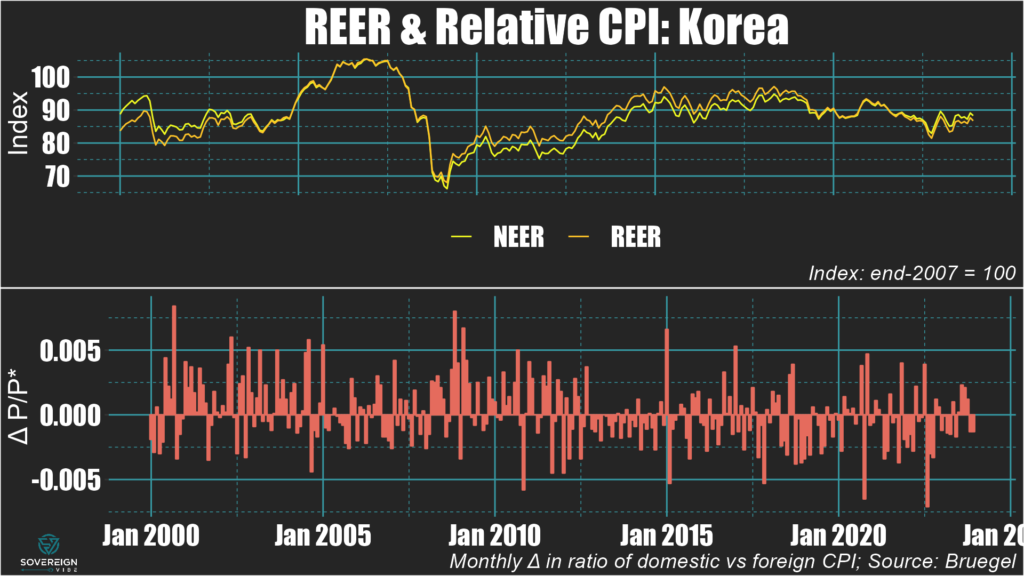
For each country, I provide a chart that breaks down the contributions of to the real exchange rate:
- The nominal effective exchange rate: Remember that “effective” implies a trade-weighted calculation against all trading partner currencies.
- Inflation differentials: This indicator looks at the month-on-month changes of the ratio of the domestic country’s consumer price index versus the trade-weighted CPIs of its trading partners. A positive (negative) differential means that the domestic country is experiencing higher (lower) inflation than its trading partners are.
As for fair values, those are covered in the next section of this post.
🇨🇳 China: The yuan depreciated by around 7.5% in real terms in 2023, on the back of two years of mild appreciation. Despite some nominal weakening, it is mostly inflation differentials driving the real depreciation, as deflationary pressures in the Middle Kingdom stand in marked contrast to the rising prices experienced by its trading partners in recent years.
🇮🇳 India: The rupee experienced a real depreciation of about 3% in 2023 against its trading partners. Comparatively low inflation and some nominal currency weakening in H2 were both at play.
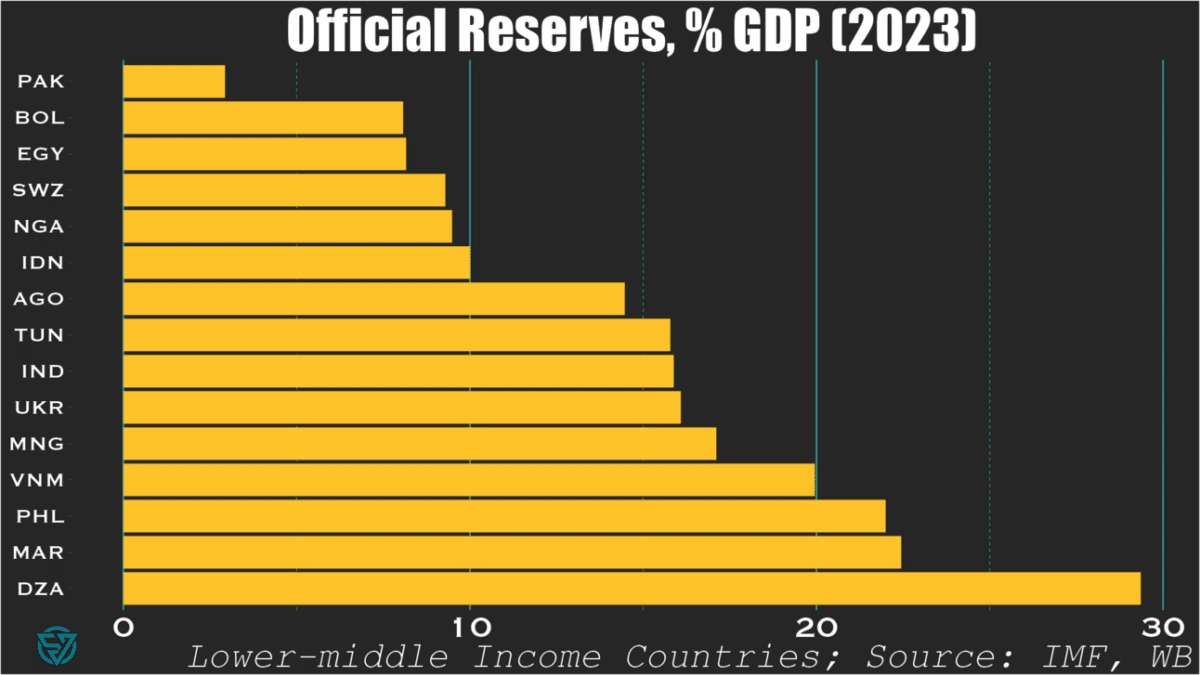
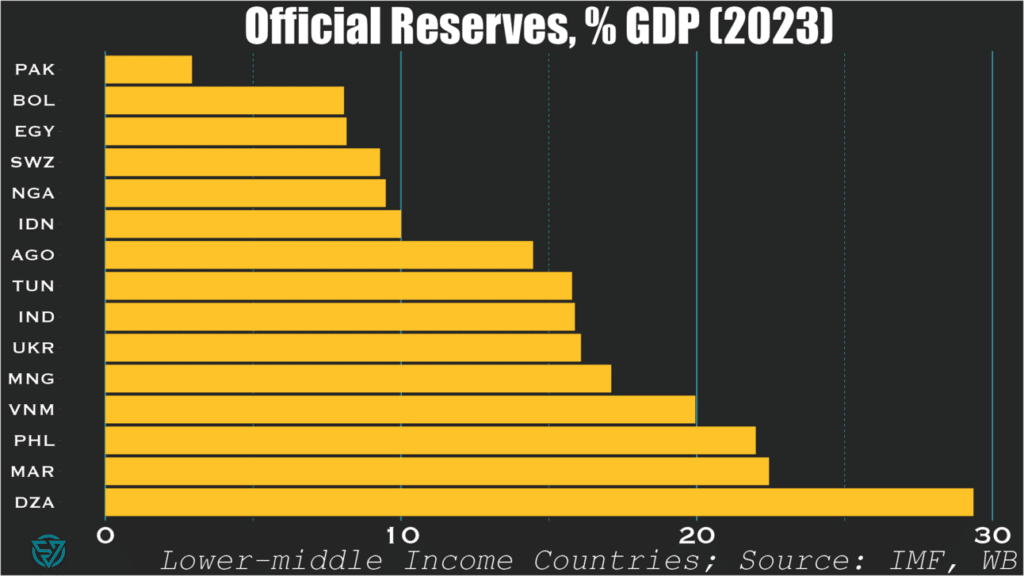
🇵🇰 Pakistan: The rupee declined by around 8% in real terms in 2023, following a smaller drop the previous year. The decrease in nominal effective terms was even larger, as inflation in Pakistan was higher than that of its trading partners for the entire year.
🇮🇩 Indonesia: The rupiah’s real exchange rate was fairly stable in 2023, registering a very modest decline in real and nominal terms alike. Inflation differentials were small and alternated between positive and negative over the course of the year, so had a negligible effect.
🇲🇾 Malaysia: The ringgit depreciated by nearly 5% in real terms over the course of 2023, with both nominal weakening and negative inflation differentials contributing.
🇵🇭 Philippines: The peso is one of the few currencies in this selection of EM Asian countries to have experienced a real appreciation in 2023, alongside the Korean won and Singaporean dollar. This modest real appreciation was driven by nominal strengthening and a positive inflation differential.
🇹🇭 Thailand: The baht weakened very modestly in real terms in 2023, mostly as a result of a negative inflation differential, while trading flat in nominal terms.
🇰🇷 South Korea: The won’s real exchange rate strengthened slightly in 2023, mirroring the nominal dynamic, with any inflation differential with trading partners close to zero.
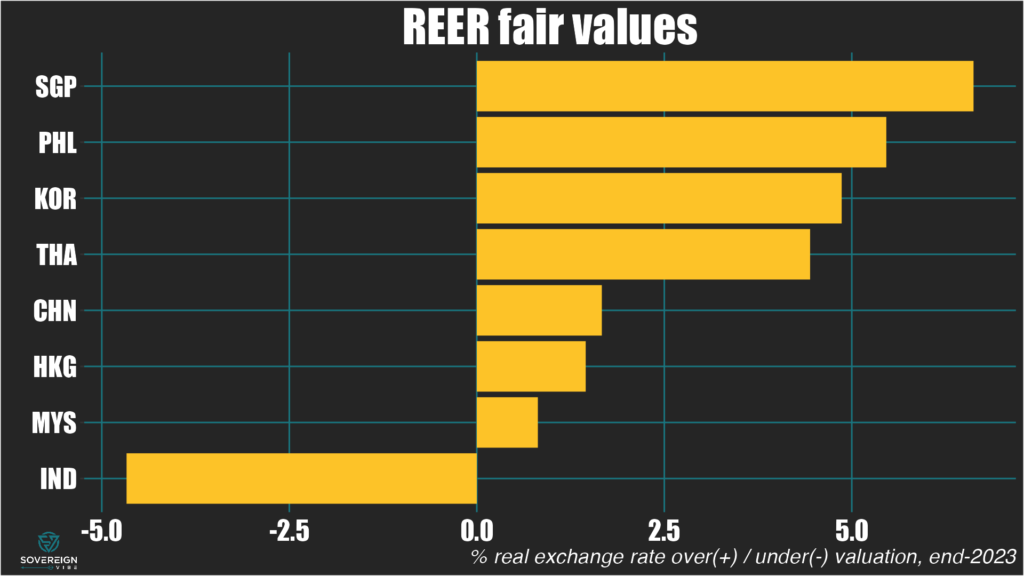
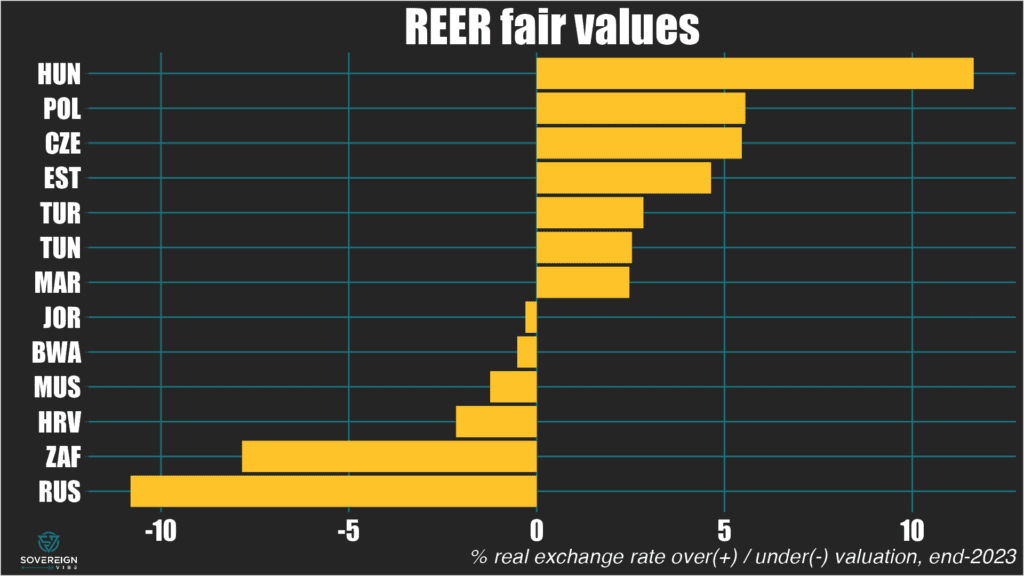
Fair Value REERs
In EM Asia, Singapore, the Philippines, Korea, and Thailand appear most overvalued.
China, Hong Kong, and Malaysia are also in positive territory. However, China’s current account is likely much larger than reported, suggesting that the yuan is almost certainly undervalued.
In contrast, the Indian rupee appears to be about 5% below fair value.
The sample of countries will be expanded in further updates of this analysis.
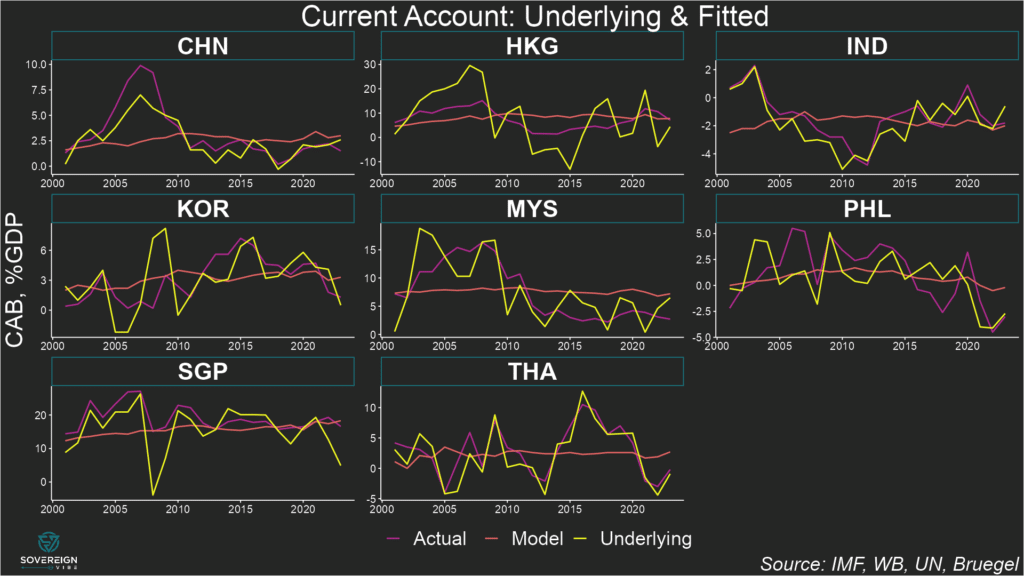
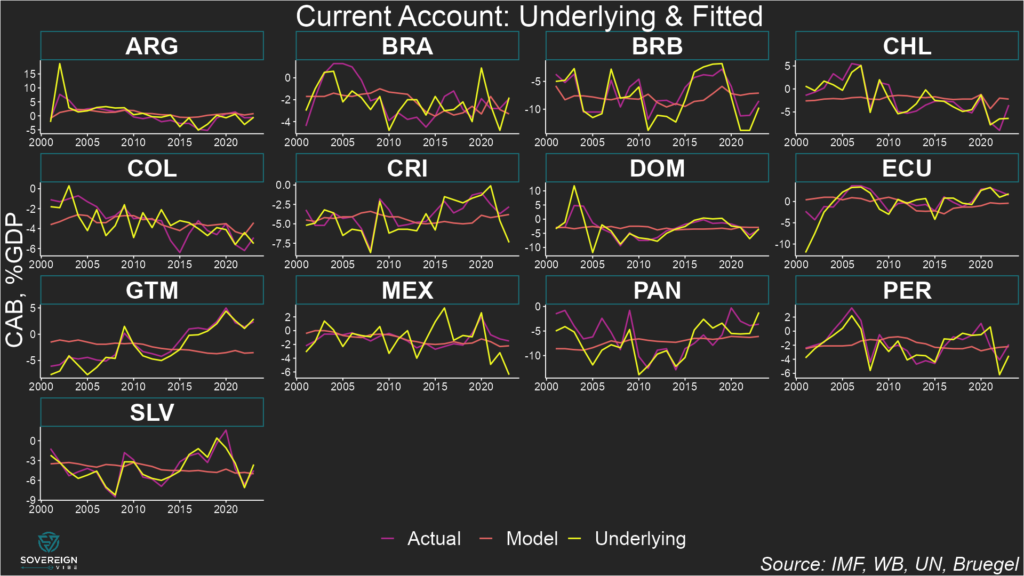
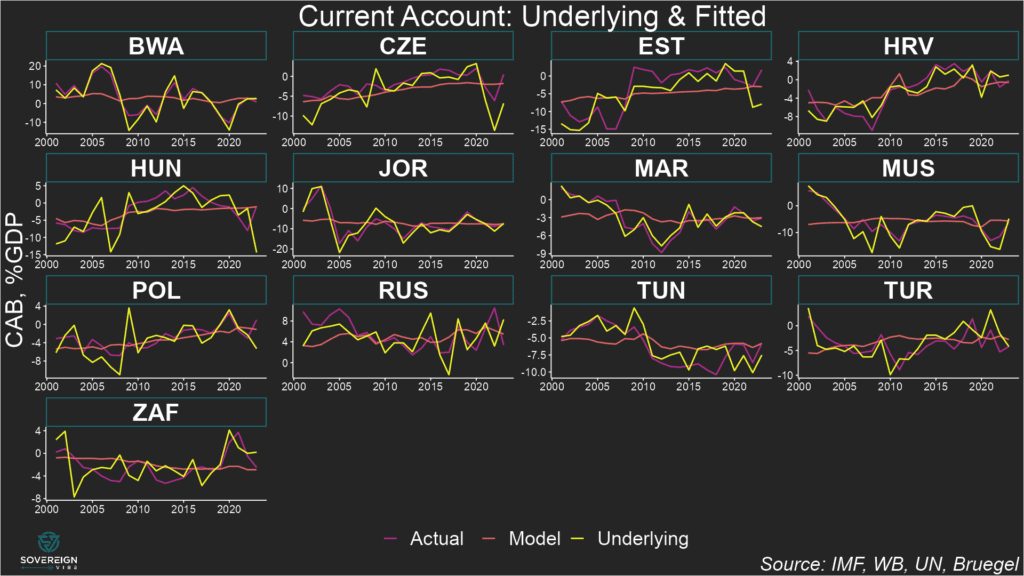
Underlying & Equilibrium CABs
The chart below shows actual, underlying, and equilibrium current account balances. When the underlying CAB is below the modeled equilibrium, the currency is overvalued in real terms. The percentage amount of over- or under-valuation of the currency is the percentage of real depreciation or appreciation needed to move the underlying CAB to equilibrium. For example:
- The Philippines’ underlying CAB is well beneath equilibrium, suggesting overvaluation. The peso would need to depreciate by about 5% in real terms for the underlying CAB to rise to equilibrium level.
- India’s underlying CAB is above the estimated equilibrium implied by the model, pointing towards undervaluation. The rupee would need to undergo real appreciation of around 5% to decrease the underlying CAB to equilibrium.
Readers should note that countries with high ratios of imports and exports as a share of GDP have CABs that are more sensitive to REER misalignment.
In other words, seeing where and underlying CAB stands in relation to equilibrium reveals where a currency is over- or under-valued, but not the magnitude of the divergence from fair value.