Categories
Emerging Markets

Where is emerging market growth fastest?

EM convergence to rich-world wealth levels is concentrated in Europe and Asia.

When I read a recent piece by Ruchir Sharma about a growth revival under way in emerging markets, I had to start investigating.

Apparently, a higher-than usual proportion of EMs (88%!) will have GDP per capita growth higher than the US in 2025-29, if IMF forecasts are anything to go by.

It seems that raw materials exports for green tech, an AI-related boom in chips and electronics, and ongoing re-shoring/friend-shoring of supply chains will be major drivers of EM resurgence. And that could well be.

My own view is that the winners and losers will be differentiated by which countries manage to move up value chains to the export of services and manufactured goods rather than natural resources.

That’s simple economic reasoning and far from contrarian. But it goes against the “Africa Rising” or “African Century” narrative that I so often hear.

Expect EM Asia ex-China, including India and ASEAN, to do continue doing well over going forward, though China will no longer be a main driver of that growth story.

EM Europe has also been overlooked as a bit of a dark horse but has posted some impressive wealth gains in recent years. And it’s poised to develop further.

For Africa, LatAm, and the Middle East & Central Asia, the future is somewhat cloudier. I’d even go so far as to say that I’m pessimistic on wealth creation keeping pace with breakneck demographic growth in Africa.

I’ve prepared some charts to help you visualize how the IMF’s data describes the past, present, and future of world regions in terms of:

  • average annual GDP growth; and
  • average annual GDP/capita growth, in purchasing power parity-adjusted constant 2017 US dollars.

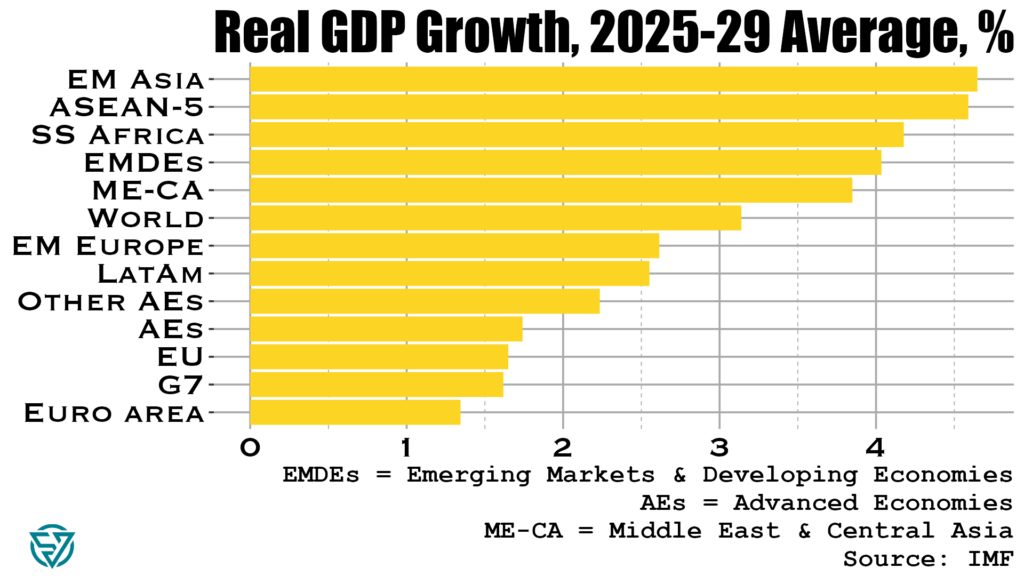
2025-29: Looking Ahead

The charts below show how emerging economies in Asia, including ASEAN, are poised to grow quickly over the next five years. The outlook also seems promising for Africa and for emerging markets as a whole.

Conversely, the IMF forecasts weak GDP growth for advanced economies. Slow growth is nothing new in Western Europe, but a sluggish G7 points to a slowdown in the US economy.

This could well be, given currently-large US deficits are draining future resources for productive investment.

On the GDP per capita metric below, Africa is dead last in the IMF’s forecast.

Sure, since the levelof GDP per capita is lower in poor countries, a small dollar change is actually larger in percentage terms in Africa than the same dollar amount would be in a richer country.

Still, these GDP per capita numbers are adjusted for purchasing power and for inflation.

So a less-than-$100 increase in income annually on average over the next five years is abysmal, especially given the importance of combating poverty and migration crises.

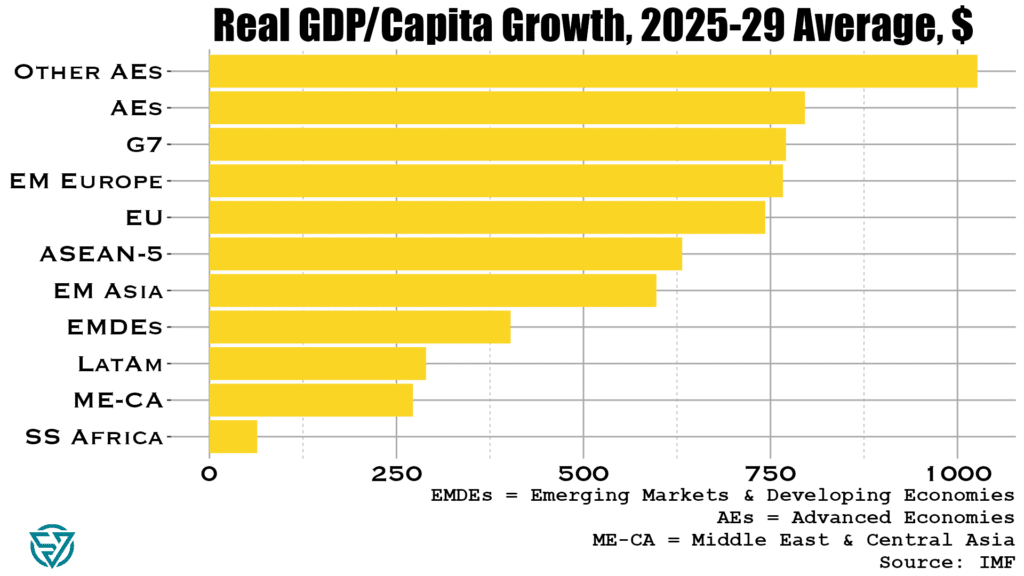
The per capita GDP growth forecast also looks lackluster for the Middle East, Central Asia, and Latin America.

On the other hand, advanced economies and EM Europe look poised to benefit from the most average annual dollar wealth creation.

2020-24: The Pandemic & Its Aftermath

The past five years have have been rough, with the global economy suffering from the polycrisis of the Covid-19 pandemic, surging inflation, and conflicts in Ukraine and the Middle East.

Advanced economies, and especially Europe, have had the weakest average annual GDP growth, along with LatAm.

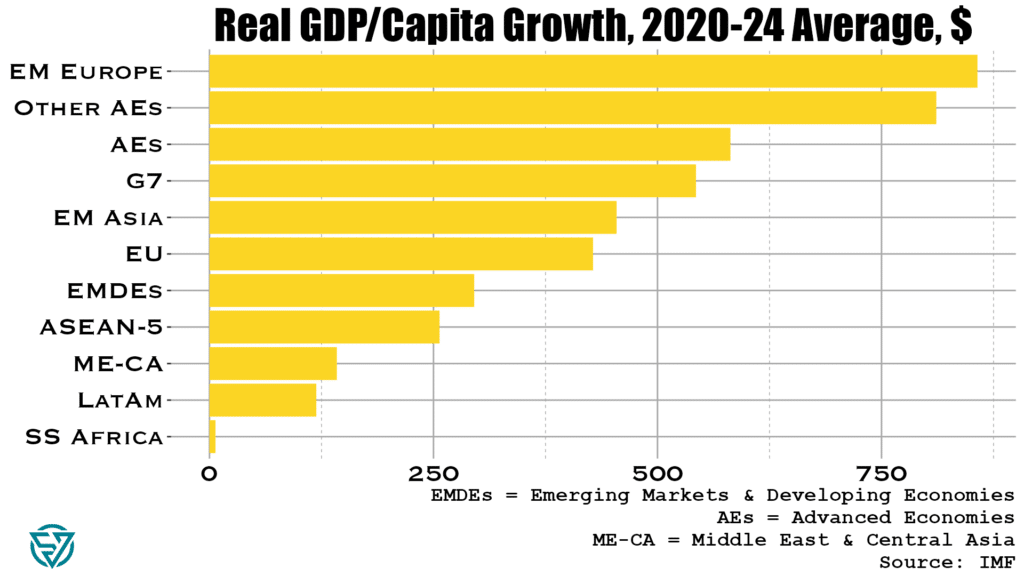
While it comes as no surprise that to see EM Asia at the top of the 2020-24 GDP growth list, EM Europe topping per capita GDP growth is surprising, given the war between Russia and Ukraine.

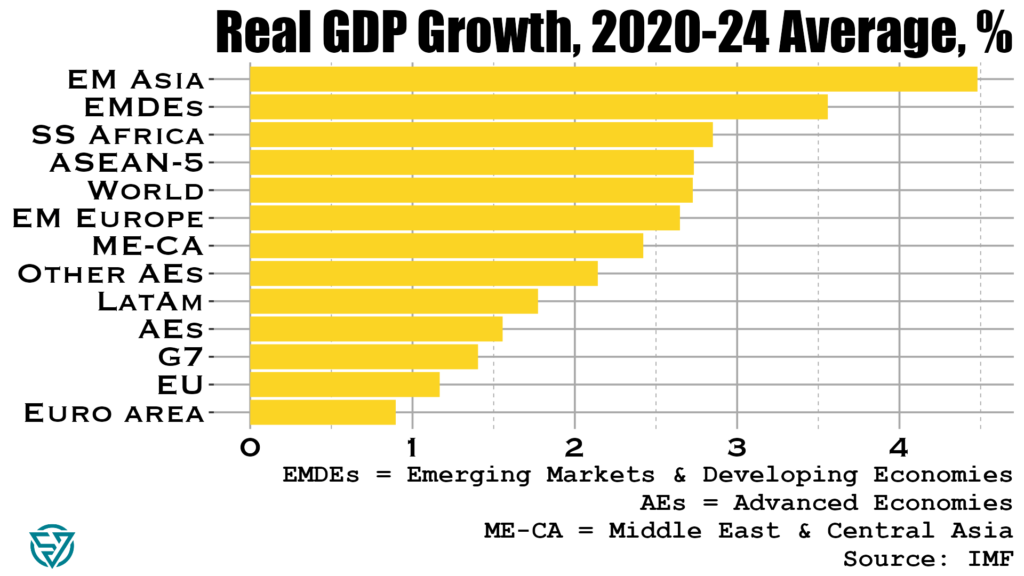
Africa managed nearly 3% average GDP growth during this period, so the continent is actually developing. But it is not doing so quickly enough to outpace its demographic boom, which is why it ranks last once again on GDP per capita growth.

It has been a challenging five years for most EM regions in terms of per capita GDP growth, while advanced economies have fared well.

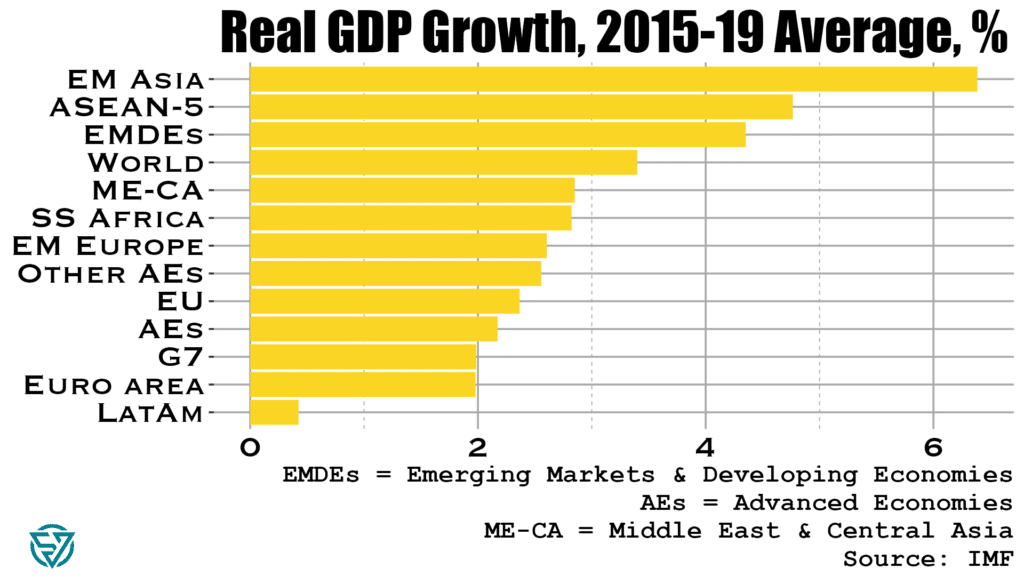
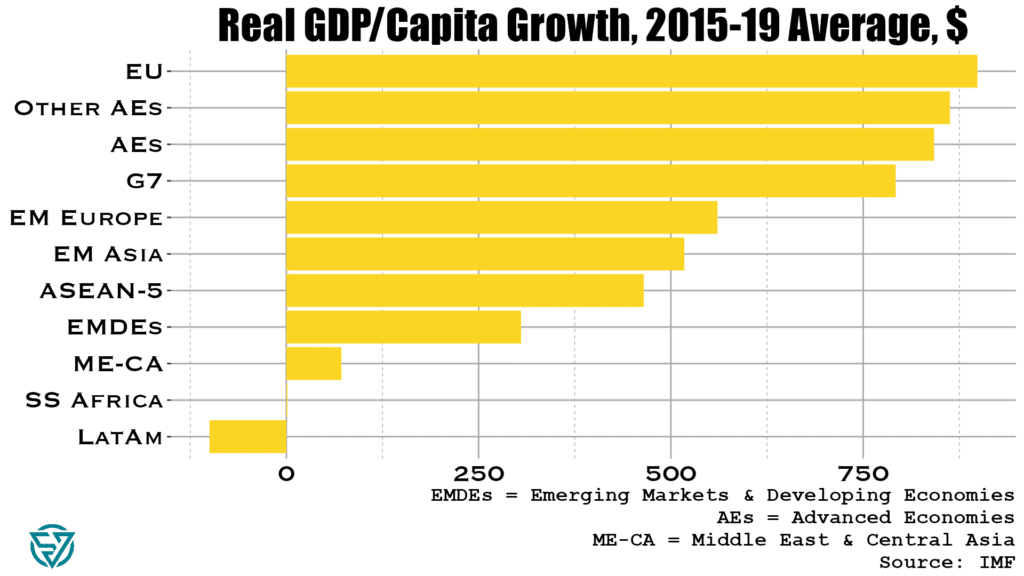
2015-19: Looking Back

The latter half of the 2010s share some similarities with 2020-24:

  • EM Asia and ASEAN posted strong headline GDP growth.
  • All advanced economies experienced strong GDP/capita growth.
  • Africa and LatAm – and, to a lesser extent, the Middle East & Central Asia -fared worst on GDP/capita growth.
Categories
Macro

The $20 trillion investment gap

In last week’s post, I discussed savings and investment across large emerging markets and the G7 countries. As has been well-documented, imbalances in the G7 have profound consequences not only on domestic economies and the rise of populism. High consumption and the low savings that result across the G7, especially ex-Japan / Germany, means that there is less capital to flow from these rich countries to emerging and developing economies.

In the US, both savings and investment are low as a share of output. Yet investment is endemically higher than savings in the US, partly as a result of strong global demand for US assets. What that robust foreign appetite means is that in most years more investment flows into the US than flows out of the country. The stock of these accumulated flows is the Net International Investment Position.

In cases where net investment flows into rather than out of a country in a given period, its NIIP declines. As such, the US has by far the world’s most negative NIIP, which stood at -$19.8 trillion in 2023. The UK has the next-largest negative NIIP, which at -$1 trillion is a far cry from the US.

Capital flows to the US, UK, and several other external deficit countries thanks to strong investor protections, rule of law, and diversified economies. With open capital accounts, it is easy for international capital to acquire assets domestically and affect prices in financial markets, real estate, and other investment categories. There is naturally a price effect, which I have begun to measure.

As a starting point, I’ve compared normalized annual changes in the US’s overall NIIP to the S&P 500’s cyclically-adjusted price-to-earnings ratio. CAPE is a valuation metric that compares current prices with the 10-year average of earnings per share.

As expected, I do find a negative association between changes in NIIP and CAPE levels. So more net investment into the US in a given year (i.e. a NIIP decrease) is loosely correlated with stock prices that are higher compared to long-term earnings.

In plain English, what this means is, for example: there were large net investment inflows into the US in 2020, 2021, and 2023, and S&P500 valuations were also high during those years. Conversely, large net outflows in 2022, 2009, and 2007 coincided with lower P/E ratios. There are of course factors other than net international investment flows at work, including monetary and fiscal policy.

So I won’t make any grand claims based on the chart above. Moreover, it has only a limited number of data points, and which are weakly correlated. I might run portfolio investment flows against price-to-earnings metrics to see if there is a tighter link. I also might look at other asset valuations, potentially in real estate, to see what the relationship is with capital inflows.

Essentially, I’m working my way towards testing whether foreign capital inflows contribute to asset bubbles in the US. As usual, I’ll also be expanding my analysis to other countries, in this case other G7 / advanced economies.

The point is to get a sense of the extent to which open capital accounts are driving asset prices in wealthy economies beyond the reach of local workers, thus contributing to the rise of populist political forces. Meanwhile, many emerging markets and developing economies have the potential to deliver better returns on investment than capital-saturated wealthy countries. But investment gaps in the EMs will likely persist as long as rich countries continue to run such large, negative NIIPs.

Categories
Macro

Is the G7 the new EM?

The past few weeks of political headlines have provided yet more confirmation of a long-term trend: the distinction between emerging and developed markets is less clear than it once was. Emerging and frontier markets are less politically stable, or so the old consensus goes.

Yet Emmanuel Macron has flown in the face of all that by dissolving France’s parliament and calling snap legislative elections. The prospects of extremist parties coming to power or of a hung parliament in France has sent European markets reeling.

Sadly, Macron’s folly is just the latest episode in a recent litany of rich-world self-sabotage. Cue January 6th, just about everything that Donald Trump does, Brexit, and the tenures of Boris Johnson and Liz Truss. To complement the Anglosphere’s masochism, add in the rise of the Italian far right, multi-faceted German despondence, and demographic reversals in Japan, Italy, and Germany. The result is something other than a pretty picture. At the recent G7 meeting in Italy, every leader save Prime Ministers Meloni and Kishida was speaking from a position of political weakness.

The upside-down global trading system

One of the driving forces behind this wealthy-country malaise is the absence of a well-functioning global trading system. Consider that savings is the difference between income and consumption. One would think then that advanced economies would have more savings than emerging economies, as they have greater income. Not so.

As a share of GDP, China, India, Indonesia, and sometimes Russia all have higher savings rates than G7 countries. In fact, only Germany and Japan have roughly equivalent savings rates, followed by Canada, France, and Italy. The US and the UK trail distantly.

The Chinese anomaly

The advantage of a high domestic savings rate is of course that a country can use these fund investments. China is an extreme example of this. By suppressing domestic consumption, Beijing has been able to jack up investment levels to dizzying heights without even running a current account deficit.

This is of course a significant problem because that abundance of savings ends up penalizing savers. The result is a vicious circle where the authorities discourage consumption in order to keep interest rates low for investment, which hurts people with money saved up in the bank. It’s a classic case of financial repression. Remember that the Chinese government directs a lot of investment from state-owned banks to inefficient state-owned enterprises. This is a recipe for slower growth, which China is currently experiencing.

Unfinished construction in a Chinese “ghost city.” Civic Data Design Lab

These chronically high savings end up “exporting” China’s weak consumer demand to the rest of the world, to the dismay of its trading partners. Juicing up savings to such levels results in over-investment domestically, without which the world’s largest current account surplus in dollar terms would be even larger. Remember that investment most typically reflects fixed capital formation, e.g. the construction of infrastructure and real estate assets. Hence the ghost cities that pepper the real estate landscape. Echoing US residential real estate pre-2007, many Chinese families had bought several apartments as investments during the boom years and are now enduring the ongoing property crisis currently afflicting the country.

CAB deficit, low investment, high consumption

The US and the UK are the best counter-examples to the Chinese model. In these countries, consumption is subsidized, partly through easy access to a diverse array of credit products at relatively low rates. Higher consumption naturally results in lower savings rates, which in turn mean some combination of:

  • Investment would have to decrease significantly for the current account to be at zero and/or
  • If investment doesn’t decrease by a lot, then there must be a current account deficit.

In reality both countries experience both low investment and current account deficits. This combination isn’t only an obstacle for directing resources towards badly-needed infrastructure maintenance and upgrades. Current account deficits make it harder for capital to flow from rich countries to poor ones that need it.

A deadly Amtrak train crash in DuPont, Washington in December 2017. Stephen Brashear / Getty Images

What we have is a world where the US, the UK, and other wealthy countries over-consume. France, Canada, and Australia are mostly in this camp as well. Over-consumption, external deficits, and financialization don’t only come at the cost of infrastructure investment and funding for international development. They also result in the outsourcing of jobs and entire industries because subsidizing consumption comes at the expense of production.

Exorbitant privilege, exorbitant cost

This status quo also reinforces the US dollar’s status as the reserve currency because US current account deficits mean that the US can flood the world with dollars. The US can do this because of well-entrenched, large global demand of US assets, whether financial, real estate, or other. This is what gives the US Treasury its “exorbitant privilege” to borrow significantly, at low cost.

Savers around the world are always keen to invest in highly-diversified economies with strong property rights. Open capital accounts across most of the developed world make it possible for capital to move around nearly seamlessly for buying and selling assets. This is one reason why asset valuations across much of the Anglosphere seem so stretched, whether stock market valuations or residential real estate prices. Local workers, even in wealthy cities like New York, Vancouver, and Sydney, are being priced out by global capital.

Moreover, a global economy awash in dollars is one where the dollar can be weaponized via sanctions. Dollar dominance also reinforces the power of US banks, which are already strengthened by domestic financialization.

This is also a system that benefits US dollar strength. While a strong dollar hurts US exporters, no one in the US government or Congress really seems to care about export competitiveness beyond lip service. Worse still is the fact that an appreciating dollar is associated with lower trade volumes and more expensive debt servicing costs on dollar-denominated debt for emerging market issuers.

CAB surplus, high investment, low consumption

On the flip side are the economies running current account surpluses. First and foremost China, but also Germany, Japan, Russia, and – sometimes – Italy. One thing that these countries all have in common is rapidly-aging populations. People in prime working years tend to consume more due to higher income levels and spending needs, including children.

China, Germany, and Japan also under-consume because they subsidize production at the expense of consumption. If you’ve ever wondered why Japanese unemployment rates are so low, consider that a relatively small working-age population has a lot of domestic exporting industries to choose from. Or why wages and real estate prices are lower in Frankfurt and Berlin than in London and Paris. Germany has kept wages and consumption low to boost manufactured exports.

Unsustainable consumption imbalances

The global trading status quo doesn’t only damage the developing countries that need access to rich-world capital. These imbalances are also causing rot at the heart of G7 economies. For the US and other deficit countries, consumption is too high. Jobs and industries have been outsourced, while asset prices have skyrocketed out of reach for workers.

In Germany, Japan, and Italy, consumption is too low in these aging societies with external surpluses. Domestic industry has survived, in part thanks to the typically-abundant savings of the elderly.

Balanced consumer demand is needed across advanced economies, in China, and beyond. Only then will more stable electoral politics return to the G7.

Categories
Macro

EM is ahead of DM in the global credit cycle

Today’s charts are snapshots of credit-to-GDP gaps in emerging and advanced economies. As a reminder, the credit gap measures the difference between actual credit to the private sector and trend credit to the private sector.

These estimates through Q3 2023 are provided by the Bank for International Settlements, which describes its credit-to-GDP ratio as capturing total borrowing from all domestic and foreign sources by the private non-financial sector.

Several factors have an impact in determining private sector borrowing. These include how developed the country’s financial system is, the ability of domestic firms to borrow internationally, and the extent to which public sector borrowing crowds out the private sector.

As such, the level of credit to the private sector as a percentage of GDP varies significantly from country to country. It is therefore more helpful to look at credit-to-GDP gaps when comparing across countries.

Besides, credit gaps are one measure that the IMF uses in measuring sovereign stress for market-access countries. A high, positive credit gap can point to the presence a credit bubble. Such bubbles are sometimes a symptom of macroeconomic imbalances and policies that can lead to sovereign debt strains.

There is little evidence of excessive credit gaps in emerging markets. The absence of credit bubbles is at least partly attributable to EM central banks hiking rates rapidly in response to inflation when it first began appearing in the latter stages of the pandemic. This early tightening has enable EM central banks to start easing before many of their developed market peers, e.g. Brazil and Mexico in Q1-2024.

Of course the chief objective of monetary policy is price stability. But, by definition, rate changes also affect credit conditions and lending.

South Korea is one of only two EMs in this sample with a sizable, positive credit gap. That excess credit is, however, declining, as the country’s central bank maintains its policy rate at a 15-year high with no signs of imminent loosening.

The other is Thailand, where the central bank is holding its policy rate steady despite political pressure to ease. In the meantime, its credit gap is also narrowing.

This relatively benign outlook across major EM is a sign of improving policy credibility compared to the volatility that led to various EM financial crises in the past. On the other hand, a negative credit gap doesn’t necessarily indicate sound macroeconomic management, e.g. see Turkey, South Africa etc.

The BIS only provides data for 21 EMs, which is already a lot. But achieving broader country coverage is why I also use similar World Bank data in my sovereign stress analysis.

Looking at advanced economies, the gaps are virtually all negative, as in EM. But, unlike EM, almost all of the gaps appear to still be widening, representing the later start to post-pandemic monetary policy tightening by AE central banks.

Note the sizable negative gap in the Euro Area (i.e. “XM”), which is a cyclical indicator suggesting that a turning point for the ECB might not be too far off. Indeed, Switzerland has recently led the way with a first DM rate cut this cycle. Japan is the outlier with its large, positive credit surplus, but tighter monetary policy has been eroding that gap in recent quarters.

Categories
Macro

Supply constraints are driving US inflation

Higher for (a bit) longer, but don’t buy into inflationista hype.

I wrote recently that emerging market sovereigns considering new issuance should be ready for Federal Reserve rate cuts in 2024, despite the hot Q1 inflation prints. The point is that core goods inflation has all but disappeared from the consumer price index and that core services inflation is concentrated in the transportation services segment, particularly motor vehicle insurance. The rise in car insurance costs in the US is a structural change, and the base effect will be locked in before long.

This inflation stickiness in transportation services is a lingering effect of Covid supply chain disruptions. Although these have lasted longer than most expected, they won’t last forever and will be resolved eventually. Juxtapose that point with data out of the San Francisco Fed that measures volume dynamics to gauge whether price rises are supply- or demand-driven. Supply is currently driving inflation, which confirms the CPI narrative around motor vehicle services.

This week of course Jerome Powell signaled that rates would be staying higher for longer. This makes good sense given higher Q1 inflation following his (overly) dovish remarks in December that markets interpreted (too) exuberantly.

One-to-two rate cuts are still priced in for this year, and any talk of new rate hikes are overblown. Powell himself said this week that a rate increase would be “unlikely.” Moreover, the Fed is slowing down its quantitative tightening program, lowering the monthly cap on US Treasuries it rolls off its balance sheet from $60bn to $25bn. So rates may be higher for longer than expected amid all the December-January euphoria, but the wind is still blowing in an “easing” rather than in a “tightening” direction.

There are other reasons that declining inflation and lower rates are likely in store later this year. Monetary policy has a lag time, so the restrictive stance that has been in place for the past few years will continue to work through the economy. There is also a post-Covid negative potential GDP trajectory gap, a point that my former colleague Robin Brooks makes. In fact, I’m hardly alone on this: see Claudia Sahm on the Covid hangover and Brian Levitt of Invesco on transportation services.

I’ll get back to more of a direct focus on emerging markets next week, but it’s important for EM watchers to keep an eye on the elephant in the room as well. Those developed market policy rates tend to have statistically significant negative relationships with capital flows to and from EM. Besides, Sovereign Vibe is also about global macro!

Categories
Macro

What does US inflation mean for EM sovereigns?

Debt management offices in emerging market finance ministries should be prepared for Fed rate cuts.

Emerging market sovereign debt issuance started 2024 off strongly with record-breaking issuance in January at ~$47bn and another ~$16bn in February, marking the highest January-February result since before the pandemic. Sub-Saharan African sovereigns even returned to the Eurobond market, with Côte d’Ivoire leading the way and Benin placing a debut issuance. Larger players including Saudi Arabia, Mexico, Indonesia, Hungary, and Romania made placements as well.

With borrowing costs having immediately fallen in the wake of Federal Reserve Chair Jerome Powell’s dovish comments on US inflation in December, the start-of-the-year timing for issuance was savvy given renewed concerns since March around higher-for-longer interest rates. With the 10-year US Treasury yield having climbed nearly 600bps since early March and the dollar also strengthening, debt management offices have likely become more circumspect regarding US inflation and the Fed.

The fading prospects of US rate cuts before H2 haven’t put a halt to activity this April out of Abu Dhabi and, more absurdly, El Salvador. And other debt management offices, including Tanzania, are also considering Eurobond issuance. Apparently EM sovereigns have issued about $93bn so far this year, which means about $30bn for March-April. These are still big numbers, but nothing close to that fast start in January.

Friday’s US inflation print came in hotter than expected, fueling ongoing concerns that rates will have to stay high for a while yet. The Fed’s preferred metric is core personal consumption expenditures (i.e. ex-food and energy), which rose 2.8% year-over-year in March – a third high monthly reading in a row. But digging through US data shows that the Fed may yet bring inflation lower soon. Looking at the consumer price index provides more granularity than is easily available through PCE, though it measures slightly different things.

In any case, it’s clear that almost all price pressures are emanating from services, with core (i.e. ex-food and energy) goods inflation having even turned negative. Within services, the largest component is shelter, which is often the case historically as well, but shelter inflation has moderated significantly over the past several months.

The main inflationary challenge is actually in the transportation services segment, which accounts for the lion’s share of services ex-shelter inflation. Within this category, motor vehicle insurance prices have been surging, e.g. 22% y-o-y in March, due to lingering Covid-era supply chain effects, changing car technology, higher car prices, and higher repair costs. It is likely that these factors are now locked in and will not rise much further, if at all. With the high base effect is now baked in, transportation services inflation will almost certainly fade over the coming months.

The upshot is that emerging market DMOs should expect US inflation to moderate over the coming months and for the Fed to cut rates at some point this year – and perhaps sooner rather than later. So I wouldn’t be surprised to see a pick-up in EM issuance again this year, though investor demand may be more for EM IG than for EM HY. Whether it’s wiser to place a Eurobond or a local currency bond, and whether offices should hedge their currency exposure in the former case is another matter. In the meantime, let the roadshows begin?

Categories
De-dollarization

The dollar-debt imbalance

One of the major announcements at last week’s World Bank/IMF Spring Meetings concerns the unsustainable rise in US government debt. While it’s old news that the budget deficit is large – $1.7tn / 6.3% of GDP in 2023 and a projected $1.6tn in 2024, I want to highlight how US debt relates to the the role of the dollar internationally. Besides, the Springs also mean there is new IMF WEO data to play with:

De-dollarization has become a hot topic in recent years, with many observers siding ideologically “against” the USD, e.g. Brazil’s president Lula asking why international transactions should occur in dollars. Many also claim that the yuan and other BRICS currencies are rising in importance. While it’s true that RMB is playing a greater role in trade invoicing and international reserves, this increase is limited to either specific countries (e.g. Russia) or has been less than the rising prominence of other G7 currencies.

Yet such grandstanding belies ignorance of why the greenback is so dominant. China scholar and Carnegie Endowment fellow Michael Pettis explains this with his usual brilliance.

Essentially, countries that run current account surpluses – (remember that the current account is the trade balance plus other sources of foreign income) – are subsidizing manufacturing. China and Germany are prime examples.

In contrast, deficit countries are subsidizing consumption. The US and – to a much lesser extent – the UK have the largest average current account shortfalls in dollar terms.

One way to think about current accounts is that they are equal to savings minus investment, on a national level. Savings is of course the difference between income and consumption. So, when a country has a positive current account balance, it is saving more than it is investing. The reverse is true for CAB deficits:

Current Account Balance = Savings - Investment

It follows that for a current account to rise, savings increases and/or investment decreases. For a current account to decline, savings decreases and/or investment increases.

Capital account

Another important piece of the puzzle is the capital account, which is open in the US and other G7 countries, but not in China. Investors understandably prefer to send their capital to countries with strong property rights, institutions, and rule of law. These robust investor protections is one of the reasons why the US and the UK and, to a lesser extent, Canada and Australia have such large deficits.

In other words, in countries with open capital accounts, when net international capital inflows are positive, the balance of payments means that the current account has to be negative (barring some potential temporary effects via international reserves dynamics).

Transfers, both internal & external

Surplus countries such as China, Germany, and Japan subsidize manufacturing at the expense of domestic consumers. Low interest rates and low wages, in China and Germany’s cases at least, result in net transfers from savers (i.e. households and workers) to manufacturing firms. Along with their manufactured goods, they are also “exporting” weak domestic consumer demand to other countries.

To resolve this external imbalance, deficit countries like the US and UK have to either decrease savings and/or increase investment. But, with companies either holding large cash balances or using them to buy back stock, there seem to be few signs of increasing investment. This means that savings must be negative. This can occur via increased unemployment, but, to avoid this, the government instead subsidizes consumption (at the expense of manufacturing) via increased household and/or government debt.

As such, exploding US government debt is partly a result of these external trade imbalances. This begs the question why the US accepts an undervalued yuan and large negative trade deficit with China, though the White House has certainly pushed back against this arrangement at various points.

Narrow interests

As is often the case, the status quo is a result that serves a specific set of narrow interests. With the US running such a large current account deficit, other countries acquire US financial assets denominated in dollars, meaning that the US exports its financial assets to the rest of the world. Doing so ensures the dollar’s status not only as a store of value but also as a medium of exchange internationally, which is what gives the US government power to levy financial sanctions and US banks power to dominate transactions.

Yet this situation is neither sustainable for the US government and households, nor is it desirable for most Americans. Even disregarding the overuse of sanctions, the effects of USD prevalence are negative abroad as well. For instance, greenback dominance has generally resulted in a strong dollar, which is not beneficial for global trade.

Unsustainable status quo: here to stay?

In fact, the global trading system works terribly. Ideally, wealthy countries would run surpluses, and EMDEs would run deficits in order to funnel rich-world savings towards domestic investment. But EMDEs present a variety of risks to investors, who prefer to have higher allocations to safer countries, e.g. the Anglosphere.

It is not the yuan or some other currency that will dislodge the dollar. Rather, it would be some combination of push and pull factors outside and inside the US. China and other surplus countries could stop incentivizing manufacturing and instead increase consumption and, in some cases, investment. US policymakers could reduce fiscal and household debt accumulation while encouraging exports of goods and services.

In both the surplus and deficit cases, restoring that balance between consumption and manufacturing would have broad-based economic benefits. Unfortunately, the prospects for either of these outcomes seem remote because of the political priorities of Beijing’s surplus maximization and of Washington’s dollar weaponization, both of which are cornerstones of this deglobalizing era. Yet since these imbalances are so unsustainable, something’s gotta give, someday.

Categories
Geopolitics

Wall Street’s fear gauge rises

The headline article in yesterday’s FT focused on the “soaring” Vix index, a well-known measure of investor skittishness.

Much ado about VIX

VIX rises when market participants expect more volatility in the S&P 500, as it reflects the cost of buying options used to profit from changes in stock prices.

It’s clear that markets are concerned that interest rates will be higher for longer in the US as the Fed grapples with sticky inflation and by escalating Iran-Israel tensions.

These are the reasons that pushed VIX this week to its highest level since October (see chart). That spike occurred amid investor worries over Hamas’s attack on Israel and before Fed chair Jerome Powell’s dovish end-of-year remarks.

VIX is actually quite low

While it is true that this could mark a turning point for markets, what stands out to me is how low VIX went in December and January. Upbeat sentiment around the Fed lowering rates by June or earlier would certainly have warranted somewhat of a decline.

But Israel’s retaliation against Gaza, Houthi attacks on maritime traffic in the Red Sea, and reversals on the battlefield for Ukraine’s military amid US Congressional delays on aid have punctuated the past several months. These should have dampened investor euphoria more than they did.

Moreover, taking the long view, VIX isn’t exactly “soaring” (see chart). Perhaps it should be higher than where it currently is, and may well rise.

But, frankly, with the pandemic and the wars in Ukraine and Gaza defining the decade so far, this modest rise in the VIX shouldn’t be at all surprising. This is what I believe is called, in the official parlance, a nothingburger.

As for the supposedly “soaring” VIX, for the FT I have only one question:

Categories
Macro

Central banks to weigh on 2024 markets

As global markets grapple with the prospect of higher rates for longer, it’s important to keep an eye on another important potential headwind: the direction of worldwide central bank asset purchases.

Without delving too deeply into the history of unconventional monetary policy, post-Global Financial Crisis the world’s major central banks implemented quantitative easing programs. This meant buying government bonds as a way to further support recovery by injecting cash into the economy. As a result, central bank balance sheets expanded significantly.

All the extra liquidity swilling around as a result of these purchases clearly has an impact on markets. When central bank buying decreases, this often seems to coincide with challenging periods for the S&P500, the MSCI All-World Index, and others. For example, 2018 and 2022 saw poor market returns, just as central bank asset purchasing was dipping in to negative territory, as presented in the chart below.

Looking at the balance sheets of major central banks, purchases of total assets are simply any changes from one period to the next. I’ve chosen a 12-month rolling window to show you annual purchases each month here.

Central bank buying was positive throughout much of the 2010s, hovering around $2.5tn year-on-year over 2016-2018, before turning negative in late 2018 and most of 2019. Annual purchases then skyrocketed to nearly $10tn during the pandemic, amid market ebullition from H2 2020 until the Omicron Covid variant dampened sentiment in November 2021 .

Since Q2 2022, annual central bank asset accumulation has been negative, reaching a nadir of some -$3tn in H2 of that year, which was a rough one for most asset classes. From late 2022 and through most of 2023, net buying headed back towards positive territory, with last year witnessing strong, broad-based returns.

In 2024, purchasing is starting to decrease again, which would be a negative signal for markets if the trend is confirmed. This tighter stance aligns with the likelihood that the Fed will keep rates at current levels for much of the year and the Bank of Japan allowing short term rates to increase when it abandoned yield curve control last October.

However, there may be a silver lining for markets. Weak growth and low inflation prints in the Eurozone are likely to lead the ECB to cut rates in 2024. While the ECB may not abandon the quantitative tightening program launched in March 2023, it is unlikely to ramp it up at a time when it needs to loosen policy. This is especially true since it has managed to reduce its balance sheet from €8.8tn in 2022 to around €6.6tn today, as visualized in dollar terms below.

Categories
Geopolitics

Populist forces on the march

With so much of the world headed to the polls in 2024, a quick stock-take of results so far and a look ahead are in order. The outcome of each contest shapes broader international trends of deglobalization.

Of populists & liberals

The paradox is that both populist and liberal political parties have pursued policies leading to international economic fragmentation. On the populist side, trade tariffs à la Trump are the most obvious example. Populism has of course also lead to schisms in western cooperation, whether Republican reticence on NATO and Ukraine, or pro-Russian leadership in Hungary and, more recently, Slovakia (see below).

Liberal political forces are also responsible for deglobalization. The prime example is the widespread use of economic sanctions by the Biden administration and Western Europe against Russia. Yet the current US administration has not only kept the Trump era’s trade barriers in place, it has also introduced more protectionist measures through the landmark Inflation Reduction Act.

Moreover, the success of liberal parties in the broad West can benefit cohesion among allies at the expense of decoupling from opponents. Case in point, Finland’s new president comes from a pro-Europe, pro-NATO party, highlighting how joining NATO bolsters cooperation within the West while also – quite understandably – turning away from Russia.

Populism has the edge

Despite these nuances, a high-level view of electoral outcomes around the world sheds light on the direction that future international economic relationships will take. By the end of the year, the US, India, Indonesia, Mexico, and many other countries will have voted. The question isn’t so much whether the world will continue to fragment, but rather how, which is what monitoring elections can help answer.

So far this year, populist forces have advanced to varying degrees in Slovakia, Indonesia, Senegal, Poland, and will likely maintain power in India. The military continues to loom over politics in Pakistan, while Bangladesh’s authoritarian Awami League has left virtually no space for any opposition.

In contrast, results in Taiwan, Finland, and Turkey have favored more liberal political parties. Similarly, upcoming legislative elections in South Korea will likely see the center-left and center-right parties continue to dominate the political landscape.

Electoral highlights year-to-date

  • Poland: The nationalist, opposition PiS party came out ahead in local elections on April 7th, but Prime Minister Tusk’s ruling coalition will likely hold on to power in most regions.
  • Slovakia: The result of April 6th’s second round runoff in Slovakia are in, with the ascension of pro-Russian politician Peter Pellegrini to the presidency confirming the country’s pivot towards Moscow, after Robert Fico’s return as Prime Minister in October 2023.
  • Turkey: The victory of the opposition Republican People’s Party in local elections on March 31st were a setback to President Erdogan’s ruling AKP, with Istanbul’s mayor Ekrem Imamoglu strengthened by this outcome.
  • Indonesia: The general election on February 14th marks a turn away from incumbent Joko Widodo’s center-left PDI-P to the nationalist, right-wing populist Gerindra party under current defense minister Prabowo Subianto, who will be sworn in as president in October.
  • Pakistan: International media have contested the fairness of the February 8th elections, though former prime minister Imran Khan’s PTI secured the largest share of the vote despite being in prison. The PML-N’s Shehbaz Sharif is now prime minister of a coalition government.
  • Senegal: Political novice Bassirou Diomaye Faye rose to the presidency in the March 24th election, defeating the government-backed candidate. Although Faye has announced several significant policy changes, the composition of his economic team has reassured investors.
  • Taiwan: The results of the January 13th presidential election represent continuity for Taiwan in its opposition to the One China policy, with the center-left DPP’s Lai Ching-te to be inaugurated as president in May 2024.
  • Bangladesh: The US State Department claims that January 7th’s general election wasn’t free and fair. In power since 2009, incumbent Prime Minister Sheikh Hasina of the Awami League has won election for the fourth consecutive time.
  • Finland: The January 28th and February 11th two-round presidential election resulted in the victory of Alexander Stubb, of the pro-NATO, pro-European liberal-conservative National Coalition party.

April elections

  • India: While there is little doubt that Narendra Modi’s BJP will secure victory in the seven-round general election, the Lok Sabha, running from April 19th – June 4th, it appears voters are willing to accept some democratic backsliding in exchange for stronger economic growth.
  • South Korea: The center-left DPK holds the most seats in the National Assembly, while its historic rival, the conservative PPP, holds the presidency. These two main parties appear to be neck and neck in polling for the April 10th legislative election.