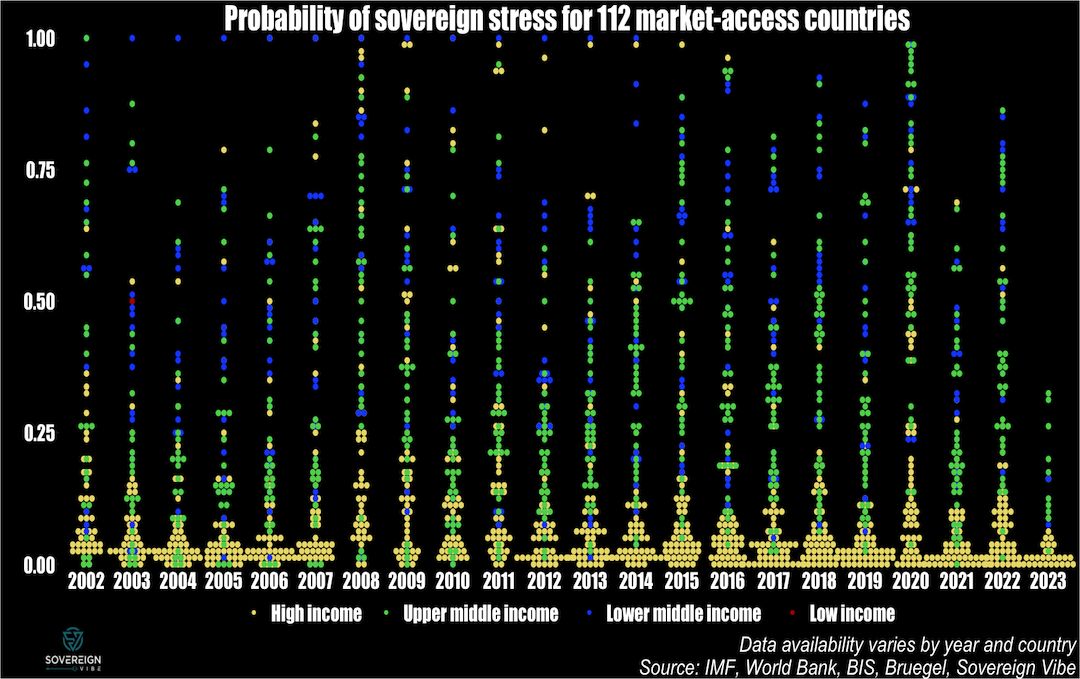
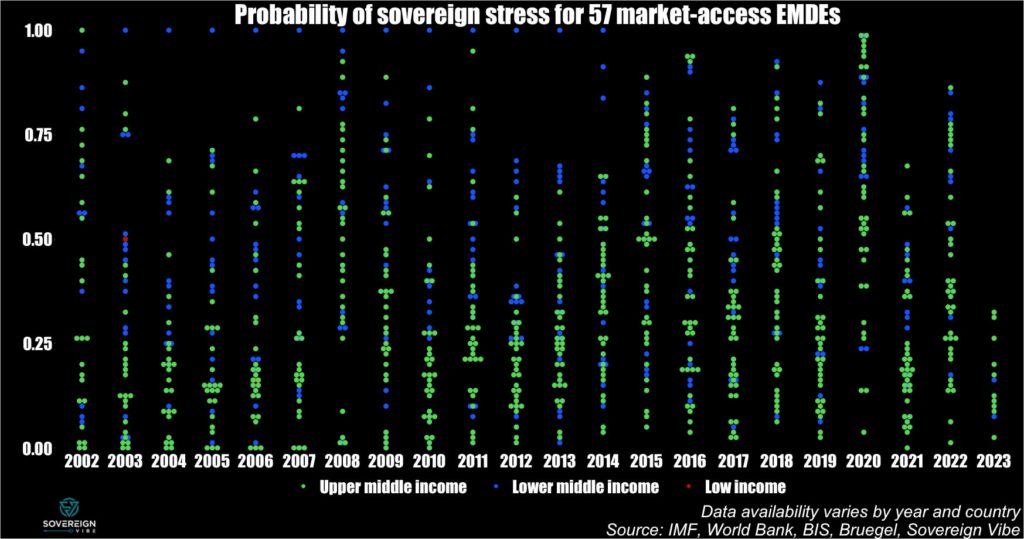
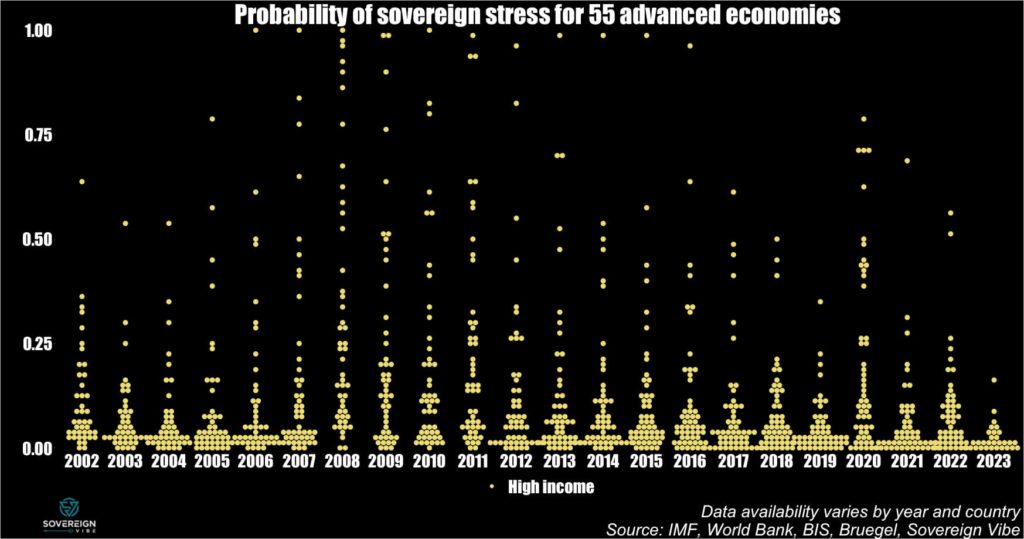
Introducing a sovereign stress tracker covering 100+ countries, based on the IMF’s Debt Sustainability Framework for Market-Access Countries. The model used in this analysis suggests that sovereign debt strains are lower in 2023 than they were in either 2022 or 2020 for this group of countries. MACs comprise all economies that are lower-middle income and above, including many emerging economies and all advanced economies.
Market-Access Countries
In 2021, the IMF released its new Debt Sustainability Analysis framework for Market-Access Countries, in line with its differentiation between MACs and low-income countries. The reasons given for distinguishing between these two groups is that MACs generally have significant access to international capital markets, whereas LICs rely on concessional resources to fulfill their external financing needs.
As such, the Fund has a separate approach to debt sustainability analysis for LICs, which is beyond the scope of this tracker. The strict definition is that countries eligible for the IMF’s Poverty Reduction and Growth Trust, which is an interest-free concessional financing tool, are treated as LICs, whereas the rest are considered MACs.
Geographic coverage
Overall, 140+ countries and territories were included in this analysis, but results were only obtained for 112,1Angola, Albania, United Arab Emirates, Argentina, Armenia, Antigua & Barbuda, Australia, Austria, Azerbaijan, Belgium, Bulgaria, Bahrain, Bahamas, Bosnia & Herzegovina, Belarus, Belize, Bolivia, Brazil, Barbados, Brunei, Botswana, Canada, Switzerland, Chile, China, Colombia, Costa Rica, Cyprus, Czechia, Germany, Denmark, Dominican Republic, Algeria, Ecuador, Egypt, Spain, Estonia, Finland, Fiji, France, Gabon, United Kingdom, Georgia, Equatorial Guinea, Greece, Guatemala, Hong Kong SAR, China, Croatia, Hungary, Indonesia, India, Ireland, Iran, Iraq, Iceland, Israel, Italy, Jamaica, Jordan, Japan, Kazakhstan, St. Kitts & Nevis, South Korea, Kuwait, Lebanon, Sri Lanka, Lithuania, Luxembourg, Latvia, Morocco, Mexico, North Macedonia, Malta, Mongolia, Mauritius, Malaysia, Namibia, Nigeria, Netherlands, Norway, New Zealand, Oman, Pakistan, Panama, Peru, Philippines, Poland, Portugal, Paraguay, Qatar, Romania, Russia, Saudi Arabia, Singapore, El Salvador, Suriname, Slovakia, Slovenia, Sweden, Eswatini, Seychelles, Syria, Thailand, Trinidad & Tobago, Tunisia, Turkey, Ukraine, Uruguay, United States, Venezuela, Vietnam, South Africa given insufficient data availability in around 30 cases. The analysis is based on a multivariate model, meaning that a missing data point for a single variable across all years makes it impossible to derive a final measurement for the country in question, resulting in exclusion.
The calculated probabilities of sovereign stress for the 112 countries do not cover all years, unfortunately. For instance, there are only results for 43 countries in 2023, given less availability of annual data and/or forecasts for the current year. Data coverage will be improved in future iterations of the tracker.
All countries included are either high, upper middle, or lower middle income countries, with few exceptions, such as Syria, which the World Bank reclassified as a LIC in 2018. There is also some debate as to whether Venezuela constitutes an UMIC or a LMIC, though it is treated as a LMIC here.
Model
The IMF claims that extensive testing demonstrates that its new MAC DSF is much better at accurately predicting sovereign debt distress. Predictive analysis is based on a multivariate logit model developed by Fund staff. Passing the required data into the model provides a probability that a sovereign borrower experiences debt stress:
Multivariate logit model specification
| Regressor | Coefficient |
|---|---|
| Institutional quality | -1.073 *** |
| Stress History | 0.514 *** |
| Current account balance/GDP | -0.024 ** |
| REER (3-year change) | 0.013 ** |
| Credit/GDP gap (t -1) | 0.086 *** |
| Δ Public debt/GDP | 0.052 *** |
| Public debt/revenue | 0.002 *** |
| FX public debt/GDP | 0.024 *** |
| International reserves/GDP | -0.034 *** |
| ΔVIX | 0.015 *** |
Results
In addition to the dotplot chart above, a further way to view the broad results from this analysis of 112 countries is as a boxplot, presented below. I fully acknowledge that this data is unbalanced, given the limited number of data points in 2023 and also in the early 2000s – as can be seen in the first chart above – compared to better country representation in the middle years of the sample. More charts are presented in the next section below in order to address this issue.
As can be seen in the data, in 2023 there appears to be less systemic sovereign stress among MACs as compared to previous years, particularly 2022 and 2020. Future posts will provide granular details and heatmaps at the country level.
Further breakdowns
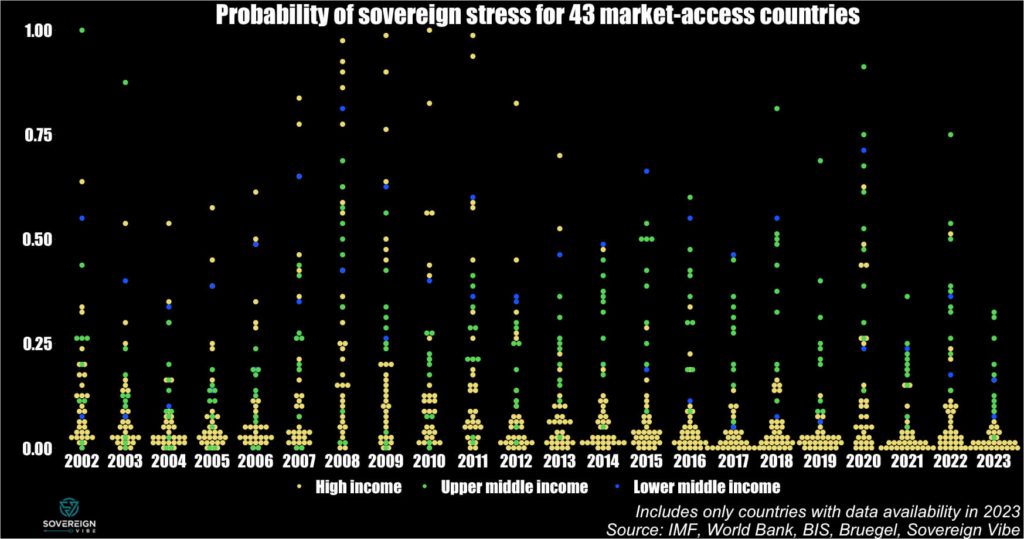
The charts below break down the data in various ways. The first ones begin by focusing on the 43 countries2Argentina, Australia, Austria, Belgium, Brazil, Canada, Switzerland, Chile, China, Colombia, Czechia, Germany, Denmark, Spain, Finland, France, United Kingdom, Greece, Hong Kong, Hungary, Indonesia, India, Ireland, Israel, Italy, Japan, South Korea, Luxembourg, Mexico, Malaysia, Netherlands, Norway, New Zealand, Poland, Portugal, Russia, Saudi Arabia, Singapore, Sweden, Thailand, Turkey, United States, South Africa for which data is available in 2023, meaning that it is more of an apples-to-apples comparison of the exact same group of countries throughout every year in the sample.
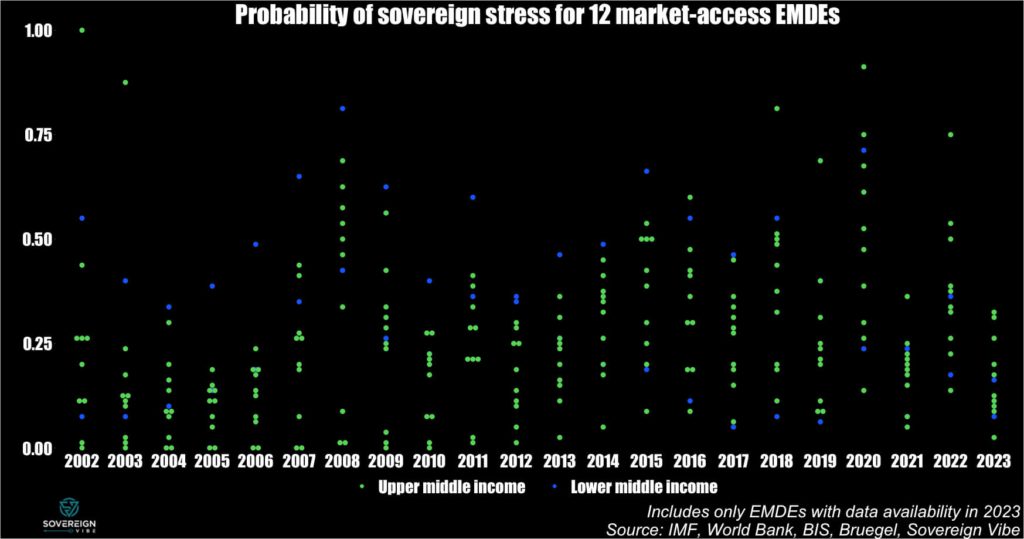
These next two exclude high income countries from the 43 countries for which there is full data coverage in 2023, to provide more of an emerging markets flavor, though coverage here is limited to 12 MACs.3Argentina, Brazil, China, Colombia, Indonesia, India, Mexico, Malaysia, Russia, Thailand, Turkey, South Africa
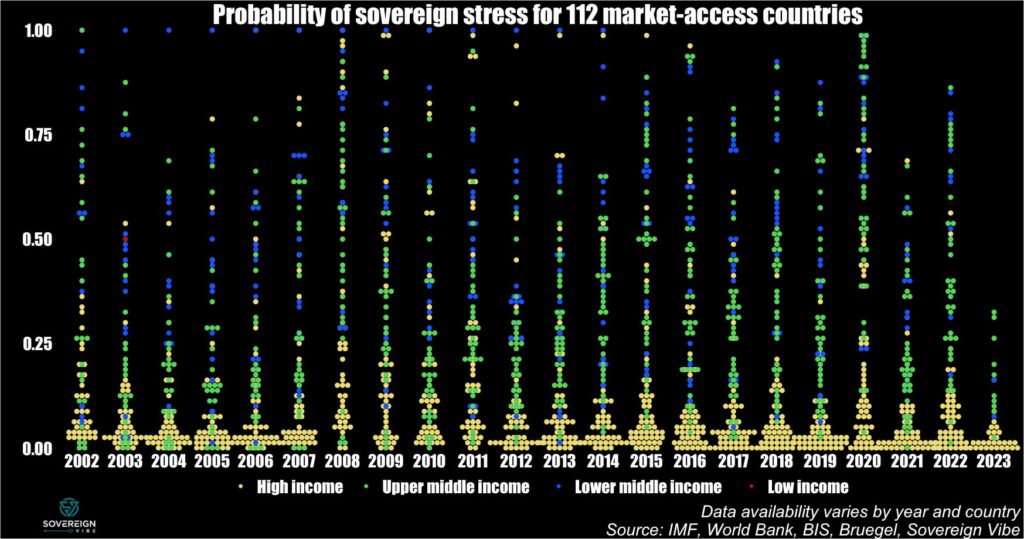
These last four charts are the results of filtering by income groups from the broad list of 112 countries. Thus the country coverage is much improved, albeit at the cost of unbalanced data and apples-to-oranges comparisons.
- 1Angola, Albania, United Arab Emirates, Argentina, Armenia, Antigua & Barbuda, Australia, Austria, Azerbaijan, Belgium, Bulgaria, Bahrain, Bahamas, Bosnia & Herzegovina, Belarus, Belize, Bolivia, Brazil, Barbados, Brunei, Botswana, Canada, Switzerland, Chile, China, Colombia, Costa Rica, Cyprus, Czechia, Germany, Denmark, Dominican Republic, Algeria, Ecuador, Egypt, Spain, Estonia, Finland, Fiji, France, Gabon, United Kingdom, Georgia, Equatorial Guinea, Greece, Guatemala, Hong Kong SAR, China, Croatia, Hungary, Indonesia, India, Ireland, Iran, Iraq, Iceland, Israel, Italy, Jamaica, Jordan, Japan, Kazakhstan, St. Kitts & Nevis, South Korea, Kuwait, Lebanon, Sri Lanka, Lithuania, Luxembourg, Latvia, Morocco, Mexico, North Macedonia, Malta, Mongolia, Mauritius, Malaysia, Namibia, Nigeria, Netherlands, Norway, New Zealand, Oman, Pakistan, Panama, Peru, Philippines, Poland, Portugal, Paraguay, Qatar, Romania, Russia, Saudi Arabia, Singapore, El Salvador, Suriname, Slovakia, Slovenia, Sweden, Eswatini, Seychelles, Syria, Thailand, Trinidad & Tobago, Tunisia, Turkey, Ukraine, Uruguay, United States, Venezuela, Vietnam, South Africa
- 2Argentina, Australia, Austria, Belgium, Brazil, Canada, Switzerland, Chile, China, Colombia, Czechia, Germany, Denmark, Spain, Finland, France, United Kingdom, Greece, Hong Kong, Hungary, Indonesia, India, Ireland, Israel, Italy, Japan, South Korea, Luxembourg, Mexico, Malaysia, Netherlands, Norway, New Zealand, Poland, Portugal, Russia, Saudi Arabia, Singapore, Sweden, Thailand, Turkey, United States, South Africa
- 3Argentina, Brazil, China, Colombia, Indonesia, India, Mexico, Malaysia, Russia, Thailand, Turkey, South Africa
4 replies on “Tracking sovereign stress in 112 countries”
[…] Framework for Market-Access Countries. In addition to the IMF’s own documentation, past posts on this site describe the model and its indicators in more […]
[…] this year I published the high-level initial results of a sovereign debt stress tracker, based on a model developed by the International Monetary Fund for countries that it classifies as […]
[…] previous credit gap analysis on this blog and how this indicator helps estimate the probability of sovereign debt strains,1As a reminder, in the IMF’s MAC DSA model published in 2021, the coefficient for credit gaps […]
[…] part of tracking the probability of credit stress among 112 sovereign issuers, one of the variables of interest in the IMF’s model is the credit-to-GDP gap. This indicator […]