
- FX fair value estimates for 13 economies across LatAm at end-2023 underscore the idiosyncrasies of recent current account dynamics in the region…
- …while also highlighting V- and L-shape nominal performance against USD since the pandemic in several countries,…
- …even as the inflationary spike in ~2022 continues to abate across the main economies covered below.
As in other parts of the world, several Latin American economies saw their real exchange rates weaken during the pandemic only to rebound sharply amid the global inflationary shock. This v-shape trajectory of LatAm REERs is most evident in Peru and Costa Rica but is also visible to varying extents in Brazil, Colombia, the Dominican Republic, Mexico, and Panama.
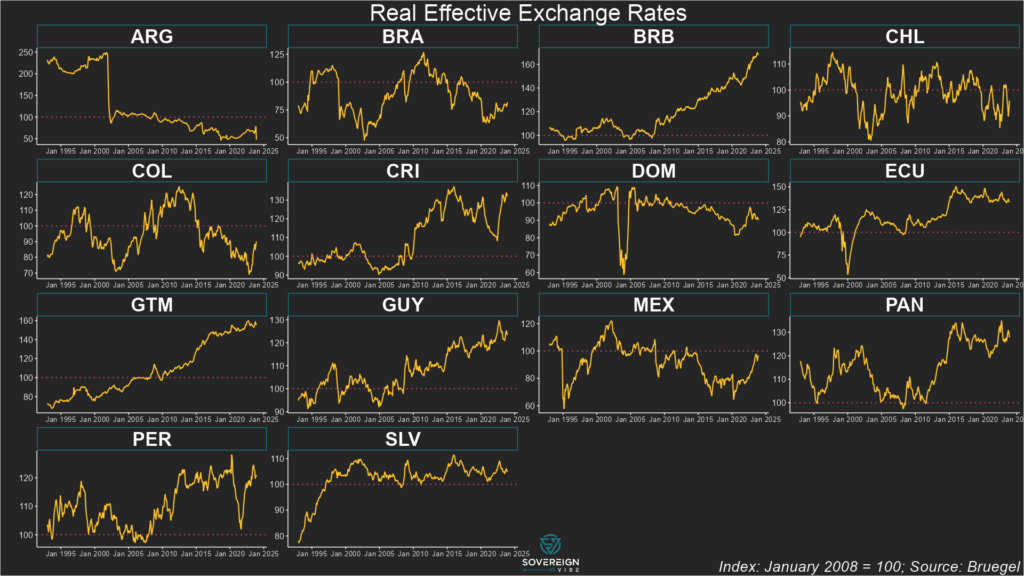
REER trends in LatAm
In nominal terms against the dollar, the main currencies in the region weakened during 2020 before strengthening to varying degrees in the years since. Inflation was generally around the 2% mark in these economies in 2020 before peaking in 2022:
- 🇲🇽 Mexican peso: after dropping sharply during the early pandemic, the peso had mostly recovered by early 2021 and traded flat until October 2022. Since then, it has strengthened significantly, despite some wobbles circa October 2023. Inflation rose from 2% in 2020 to ~8.5% in 2022 before declining to the 4-5% range in 2023/Q1 2024.
- 🇧🇷 Brazilian real: weakened significantly in H1 2020 and has traded between flat and very moderate strengthening since. Inflation rose from 2% in 2020 to 12% by early 2022, and has remained mostly in the 4-6% range since late 2022.
- 🇨🇴 Colombian peso: a sharp drop in March 2020 before almost recovering by the end of the year. Then steady weakening until June 2022, when it dropped sharply, followed by a strong recovery throughout 2023. In early 2020, inflation stood at 4% but declined to sub-2% that year, before beginning to rise in H1 2021, culminating in a peak above 13% in late 2022/early 2023 and since declined to the 8-10% range.
- 🇨🇱 Chilean peso: came under pressure in March 2020 but only after having experienced a sharper drop in late 2019, so its decline during the pandemic coincided with a pre-existing weakening trend. By May 2021 it had more than recovered the early-pandemic weakness, then steadily weakened to October 2022. Subsequently, it bounced back in mid-2023 before declining again. Inflation hovered in the 2-4% range in 2020 before beginning a long steady rise from 2021 onwards, peaking at 14% in 2022 and declining to circa 4% by end-2023.
- 🇵🇪 Peruvian sol: a steady, significant decline from early 2019 to September 2021, followed by flat-to-moderate strengthening. Inflation stayed around 2% throughout much of 2020 before rising to around 8.5% in H1 2022, and then beginning to moderate in H1 2023, dropping to below 4% by the end of the year.
Regarding fair values, the broad REER trends described above don’t really shed that much light, as valuations depend on where underlying current account balances stand in relation to equilibrium.
Fair Value REERs
In LatAm, Chile, Mexico, Costa Rica, Argentina, and Colombia appear most overvalued, while Guatemala, Panama, Brazil, and Ecuador seem most undervalued.
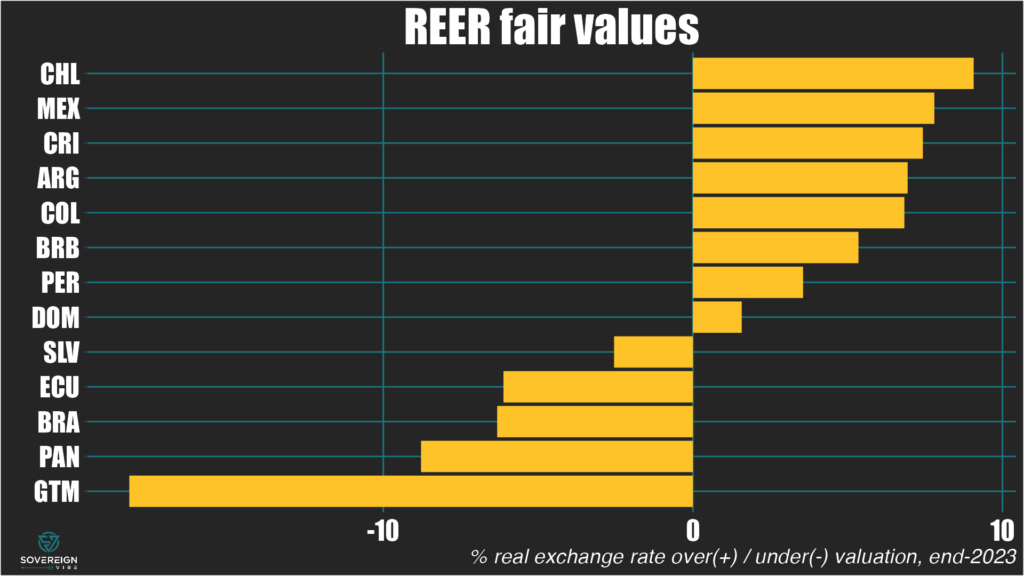
In this sample, the Dominican Republic and El Salvador are closest to fair value. Peru’s overvaluation is also relatively small.
Underlying & Equilibrium CABs
The chart below shows actual, underlying, and equilibrium CABs. When the underlying CAB is below equilibrium, the currency is overvalued in real terms. For example:
- Chile’s underlying CAB exhibits a significant drop-off, with the headline CAB also being below equilibrium.
- Mexico’s underlying CA deficit is even deeper in the red at around -6% of GDP, well below equilibrium.
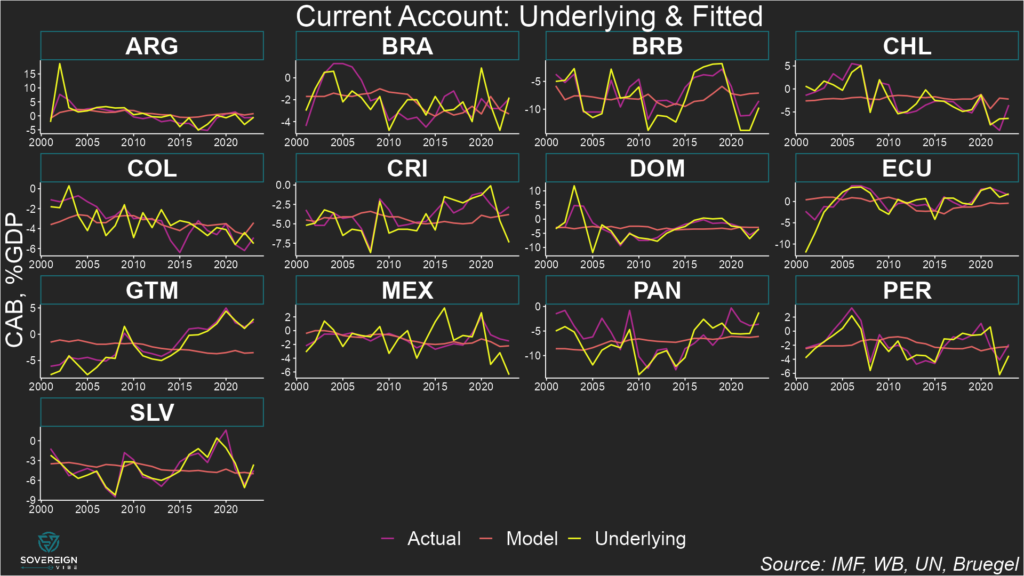
Conversely, when underlying CABs are above estimated equilibria, the currency is undervalued in real terms. For example:
- Guatemala exhibits a CA surplus of around 2.5% of GDP, about 5 percentage points above its estimated equilibrium.
- Panama’s CA deficit is above its estimated normal level, which is quite low at around -7% of GDP and explained by some of the unique characteristics of the country’s economy.
- Brazil has registered some large swings in its underlying CAB in recent years, meaning that the real has alternated between over- and under-valuation.
Readers should note that countries with high ratios of imports and exports as a share of GDP have CABs that are more sensitive to REER misalignment.
In other words, seeing where and underlying CAB stands in relation to equilibrium reveals where a currency is over- or under-valued, but not the magnitude of the divergence from fair value.
Stay tuned for more currency fair values in Asia and beyond.