
De-dollarization has become an increasingly popular topic in recent years, and for good reason. Indeed, the global economy has been gradually entering a period of deglobalization for the past decade or so, and, in parallel, the U.S.-led nature of the international economic order is facing challenges from geopolitical competitors and a disenchanted Global South.
Yet much of the ideologically-driven discourse on the greenback’s supposedly-imminent demise fails to account for the USD’s security and demographic underpinnings and the absence of viable alternatives. The U.S. dollar’s role is both a reflection of and a driving force behind the moral values governing the global financial architecture, with significant implications for global economic growth, international security, and the fate of Ukraine.
This article will be the first of many to explore de-dollarization and related phenomena, including sanctions, trade, and geopolitics. As a starting point, tracking the use of the U.S. dollar in international sovereign reserves and in international trade provides a solid foundation for further analysis.
Official Foreign Exchange Reserves
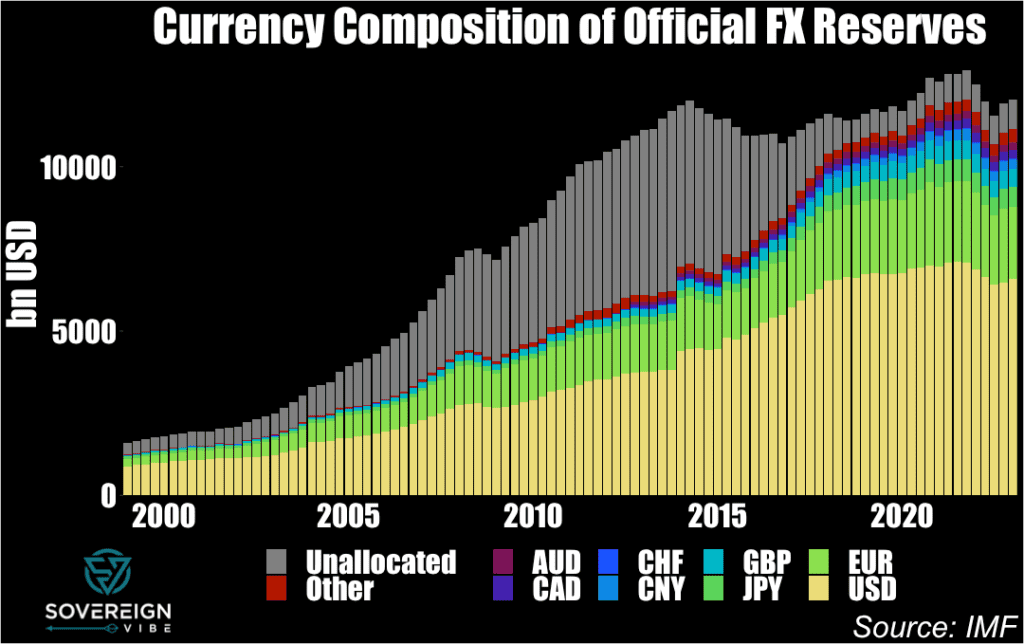
The chart above illustrates the prominence of the USD in governments’ international reserves, accounting for over $6.5 trillion as of Q1 2023 – nearly 60% of the global total.1The “unallocated” reserves in grey are merely the USD value of official FX reserve assets for which the IMF has no currency decomposition. The IMF collects this currency composition of reserves data from its member countries, many of which report it on an anonymized basis for public disclosure.
Unfortunately, a currency breakdown of reserves by country appears to be unavailable to the public via the IMF, which is partly understandable given geopolitical sensitivities that some countries may have in revealing this information. Still, this opacity is yet another of a plethora of examples of sovereign financial data transparency practices found wanting, even if currency composition may be available from some national sources.
While the first chart at the top of the piece shows absolute totals and is useful in seeing changes in global reserve quantities – such as the quarterly declines in 2022 – a proportional view is more helpful from a de-dollarization perspective. The interactive chart below shows that from a peak in this sample of over 72% in the early 2000s, for the proportion of reserves disclosed2The IMF designates these as “allocated” official FX reserves. by currency to the IMF, the USD slumped to a trough of just under 59% in Q4 2021, a 13-percentage points decline.
So which currencies did the USD lose ground to? China is indeed part of the story, with CNY having risen from nil to…a peak of merely 2.8%. That leaves 10 of the 13 ppts to account for. The euro also contributes to the USD decline but only modestly because, despite its share having risen in the middle years of the sample, in 2023 it only stands at ~1-2 ppts above where it started 24 years ago. The yen is certainly not the culprit, as it has actually lost some ground as well, albeit only 0.5-1 ppt depending on chosen measurement times.
It is in fact other currencies that explain most of the USD’s loss of share in official reserves, especially sterling and the Australian and Canadian dollars. GBP accounts for a nearly 2 ppts rise from 1999 to 2023. AUD and CAD are slightly harder to measure over the full sample period because the IMF clearly recategorized them both in 2012, moving them from the “Other” currency category into their own standalone categories, presumably because of their growing shares. In 1999, the “Other” category stood at some 1.6%, while summing “Other” with CAD and AUD in 2023 yields a figure of 7.7%, pointing to a 6 ppts difference, of which only 1.7 ppts came from currencies other than CAD and AUD. To simplify, CAD and AUD combined for a 4.3 ppts bite into the USD share.
The reality of other advanced economy currencies displacing the USD as a reserve currency stands in marked contrast to prevailing ideological narratives that the USD decline is related mostly or solely to the rise of emerging market currencies such as CNY. While there is ample evidence for central banks repatriating gold in the wake of U.S. sanctions against Russia and freezing of its reserve USD assets following Moscow’s invasion of Ukraine in February 2022,3https://www.reuters.com/business/finance/countries-repatriating-gold-wake-sanctions-against-russia-study-2023-07-10/ there has been no associated decline of the USD’s reserves standing. In fact, since the war began last year, the USD slice has risen from just under 59% to over 60% this year, while the yuan’s has fallen by 0.2 ppts.
Trade Invoicing
In 2020, then-IMF Chief Economist Gita Gopinath and colleagues published an IMF working paper4https://www.imf.org/en/Publications/WP/Issues/2020/07/17/Patterns-in-Invoicing-Currency-in-Global-Trade-49574 on the invoicing of international trade by currency, building on Gopinath’s prior extensive academic work in this area.
Here too there is broad-based evidence of a declining role of the USD. The greenback’s decline is most evident when comparing the early 2000s to the present day, though Gopinath, Boz, et al.’s dataset has less country coverage that far back. For this reason, the most recent year of available data – 2019 – is compared to 2010, to provide a snapshot of currency invoicing of exports and imports trends over the decade.
The two charts below show overall lower use of the USD in export and import invoicing in 2019 versus 2010 in most countries, although there are outliers on either side of the diagonal change demarcation line, e.g. Russia and Cyprus. As with official reserves, it appears that another advanced economy currency – the euro in this case – could be responsible for taking away USD market share, as many of the country declines are either in the Euro area or in Europe.
The situation is different for EUR, which saw its trade invoicing presence grow in most of the sample countries in the 2010s. This confirms the suspicions above that EUR was displacing the USD in the euro area and Europe but goes further by demonstrating EUR’s growing role outside Europe as well, e.g. Israel, Chile, Indonesia, Thailand.
These last two charts present the change in invoicing in currencies that are neither the USD nor the EUR and appears to include a country’s home currency, at least for imports.5The metadata in the dataset leaves room for ambiguity on this nuance. Here the picture is mixed, with a relatively even balance between increases and decreases across countries over the period. Yet some of the outliers provide compelling avenues for further research. For instance, Tunisia’s apparent switch from invoicing imports in its home currency in 2010 – prior to the Arab Spring, which had its tragically self-immolating spark in Tunis in 2011 – to USD by 2019 raises questions in need of answers, as do the cases of Russia, Ukraine, Cyprus, and Mongolia.
- 1The “unallocated” reserves in grey are merely the USD value of official FX reserve assets for which the IMF has no currency decomposition.
- 2The IMF designates these as “allocated” official FX reserves.
- 3https://www.reuters.com/business/finance/countries-repatriating-gold-wake-sanctions-against-russia-study-2023-07-10/
- 4https://www.imf.org/en/Publications/WP/Issues/2020/07/17/Patterns-in-Invoicing-Currency-in-Global-Trade-49574
- 5The metadata in the dataset leaves room for ambiguity on this nuance.