Categories
Emerging Markets Geopolitics

Trump’s red wave puts emerging markets under water

Double-whammy of higher U.S. yields and stronger dollar, with peak deglobalization still to come

Most people think my newsletter is only about sovereign debt.

This is a fair assumption: after all, “sovereign” is in the name.

But it’s also about deglobalization, geoeconomic fragmentation, slowbalization.

Or whatever other convoluted term you want to label the post-2016 Trump victory 1.0 and Brexit world as.

I write about these topics as well because they are so closely intertwined with what is happening in the emerging markets and sovereign debt space.

The daily symptoms of this world are often sanctions and tariffs, or any other number of phenomena that harden borders and disintegrate international relationships.

And it’s this reigning ambiance that also led me to call this newsletter “Sovereign Vibe.”

Countries are turning inward, putting themselves first, and promoting isolationist and protectionist policies in one form or another.

It’s sovereign first, friends next, enemies last, and multilateralism forgotten.

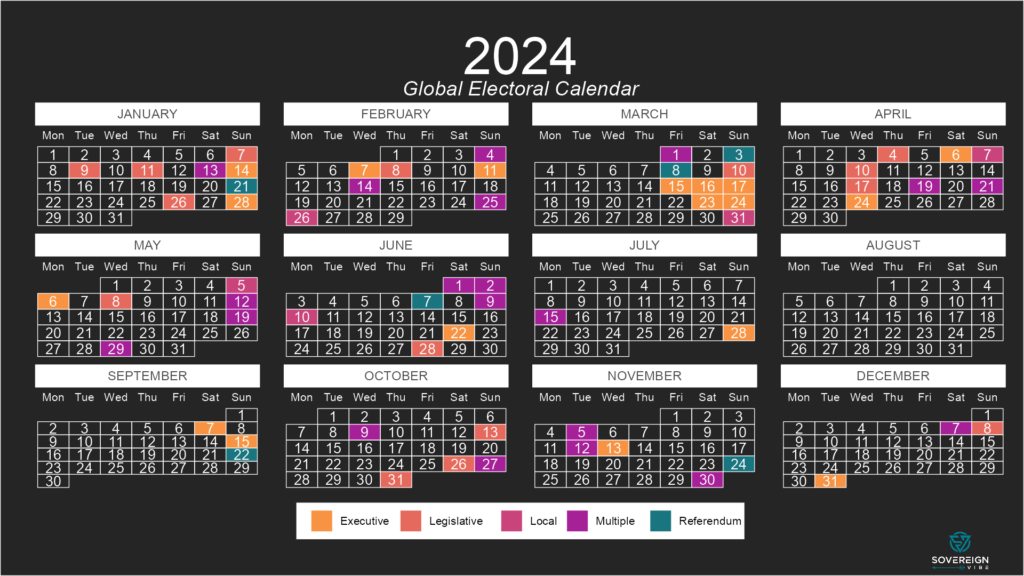
Never has that been more true than after Trump’s sweeping 2024 electoral triumph, carrying the U.S. popular vote and a strong mandate for “America First” policies.

Buckle up: we’re going to be in for a wild four years and beyond…
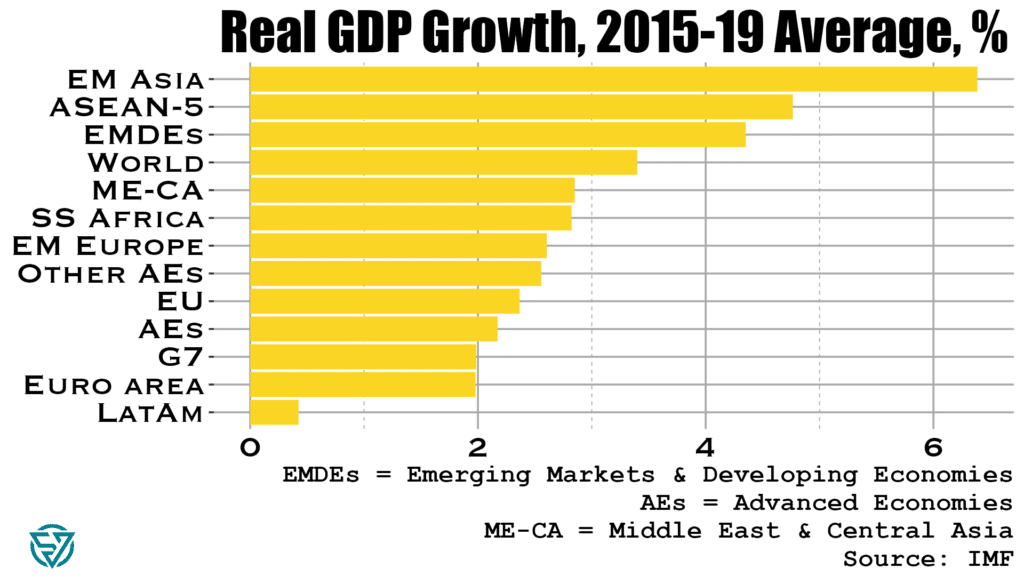
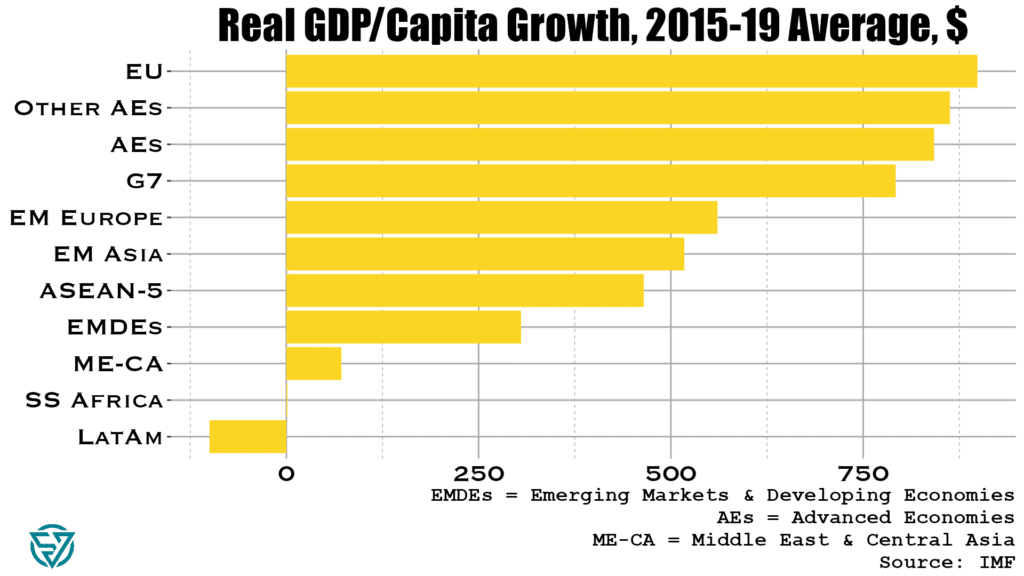
Exporters at risk

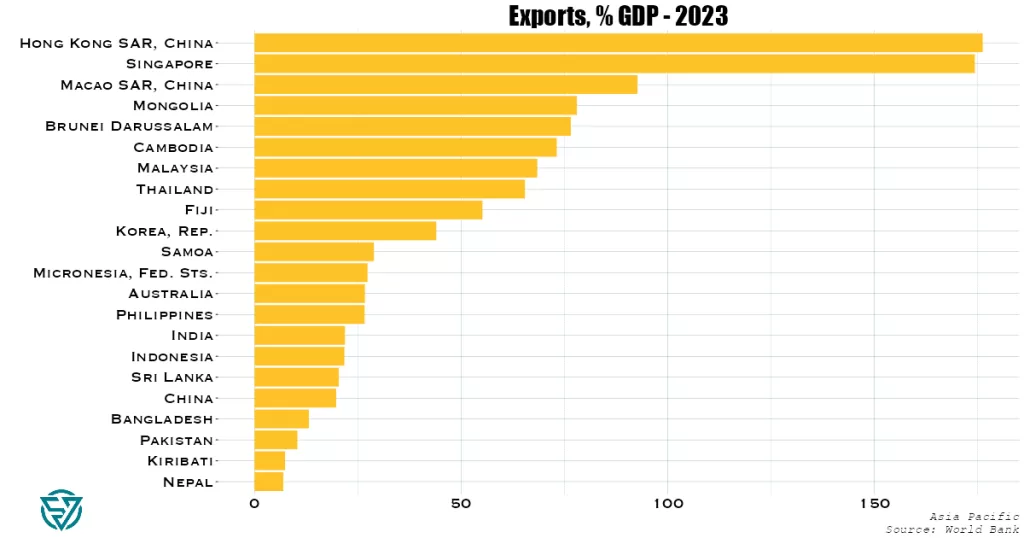
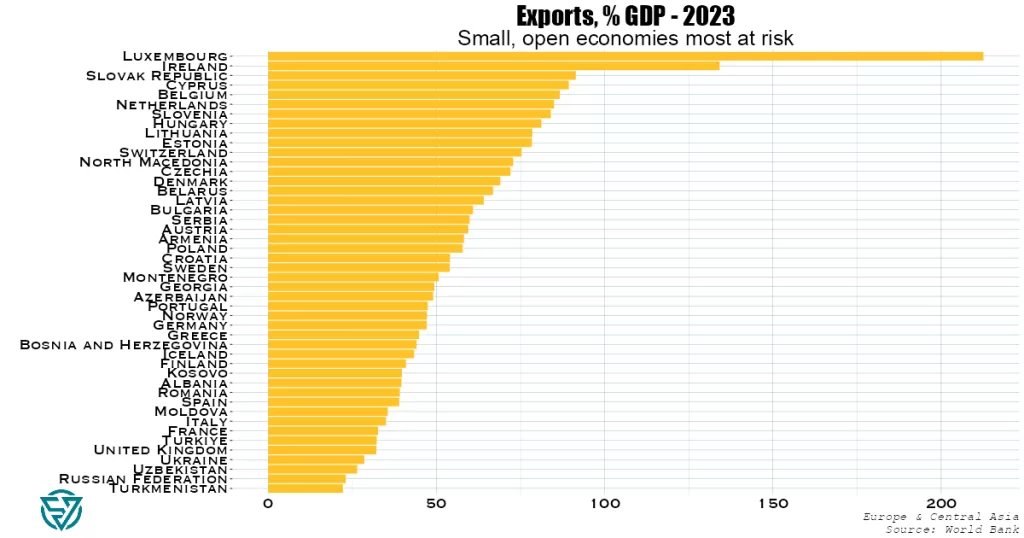
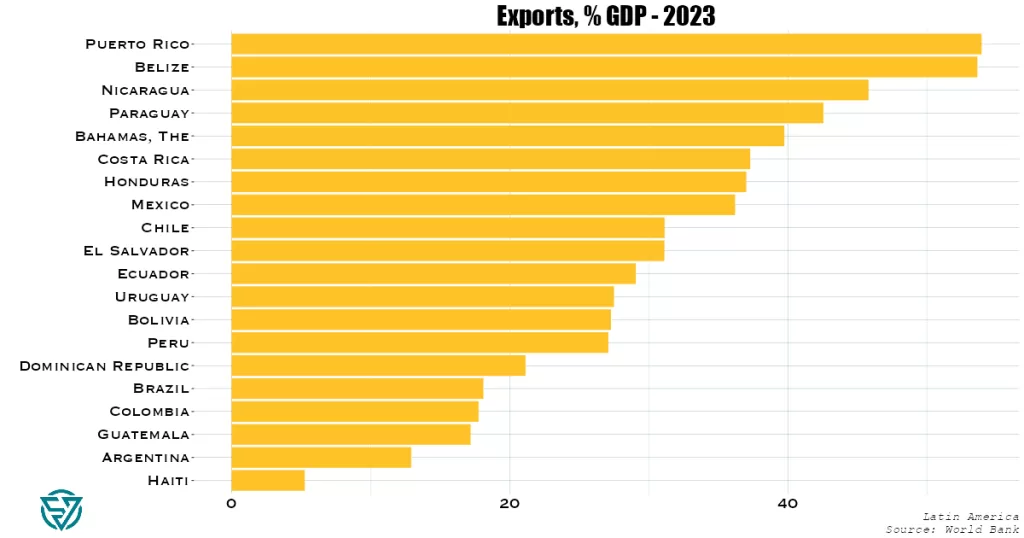
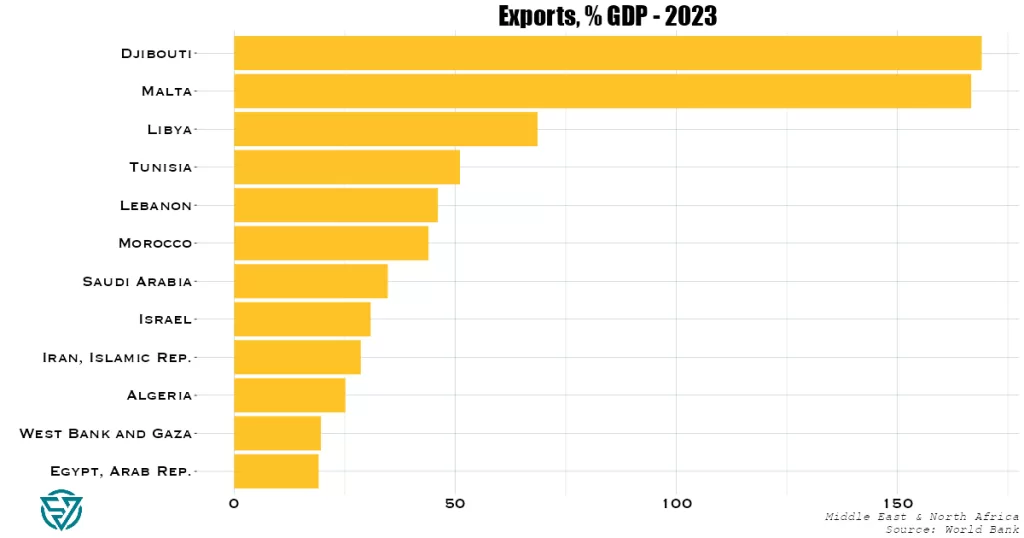
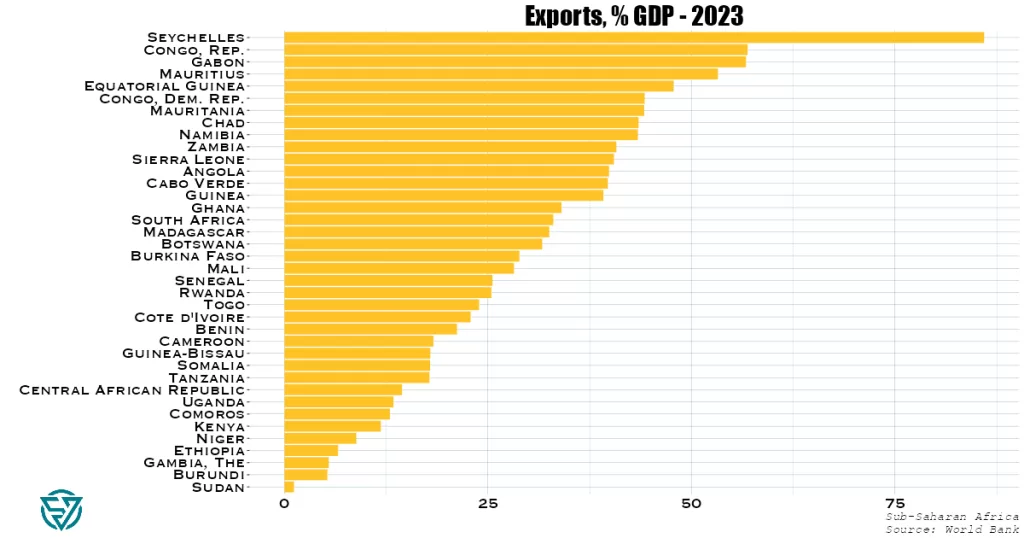
With Trump proposing 60% tariffs on imports from China and 10-20% on imports from the rest of the world, countries with a heavy reliance on exports are at risk.

This is especially true for countries with direct export exposure to the U.S., though interconnected global supply chains means that countries with high shares of exports to GDP may be particularly vulnerable.

While Trump’s trade policies may take aim mainly at manufactured goods, it is unclear the extent to which they will target services and raw materials.

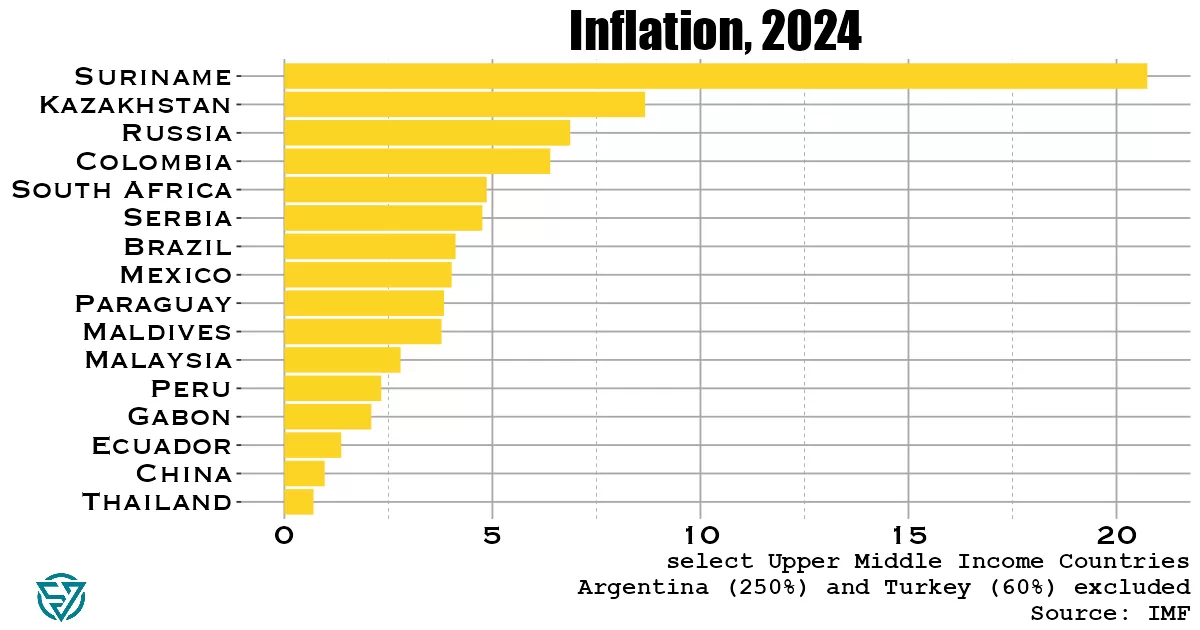
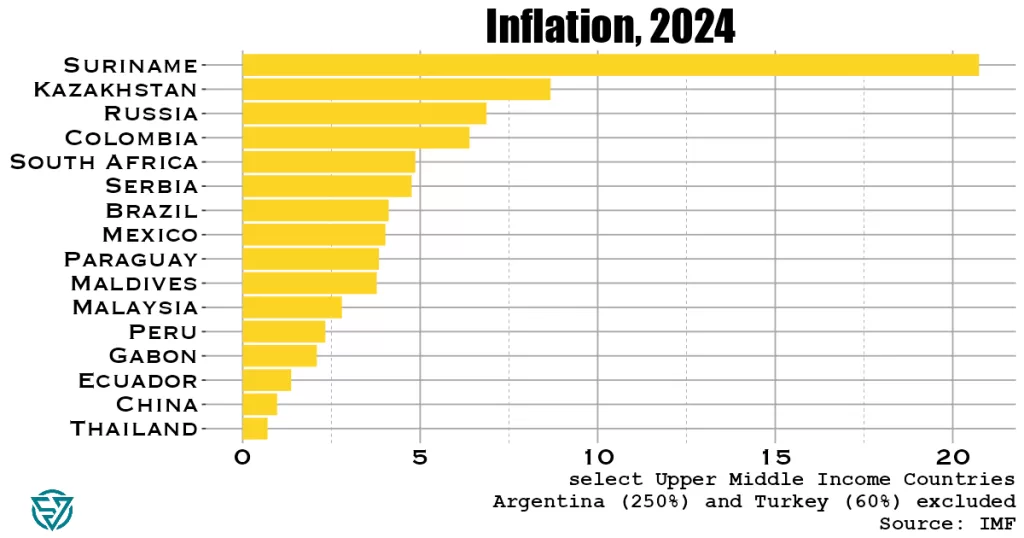
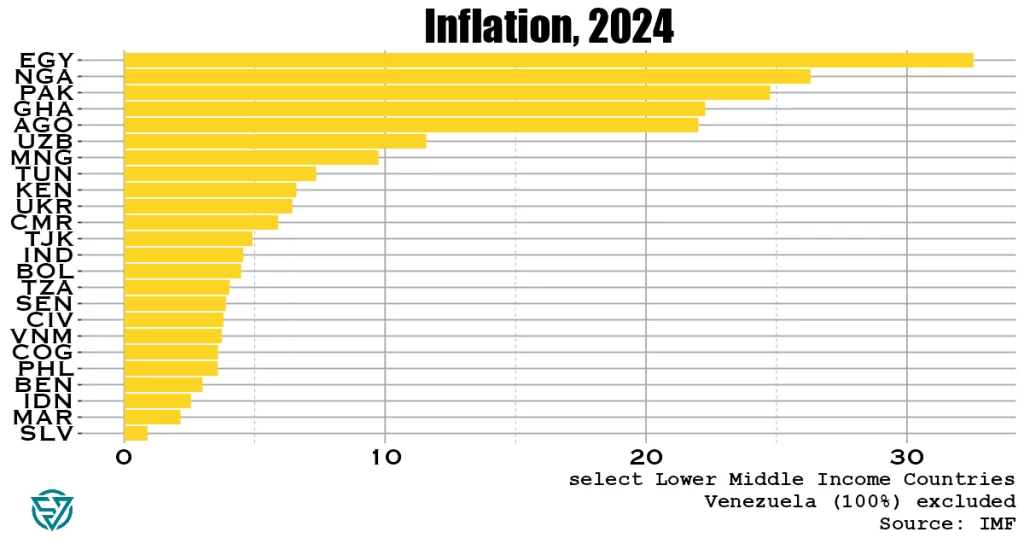
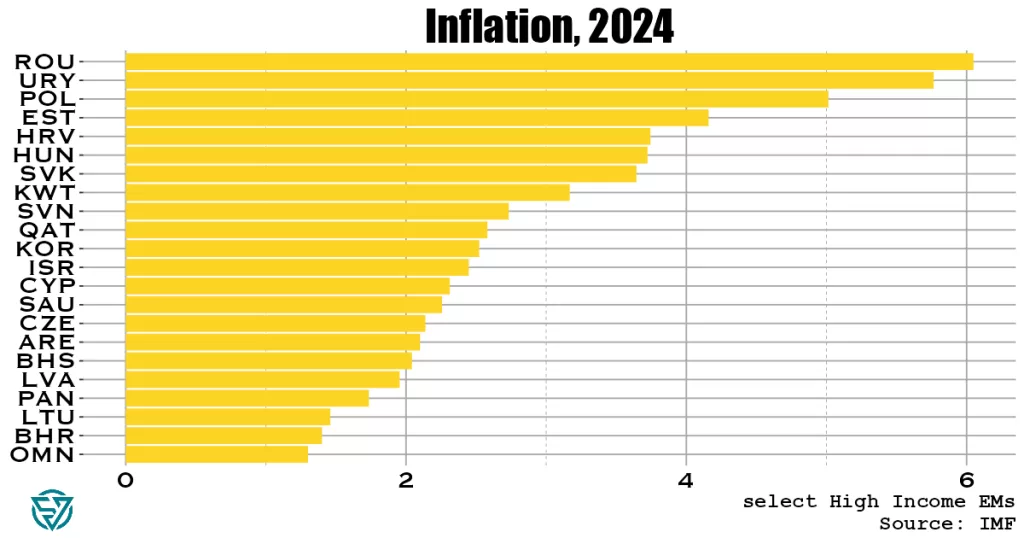
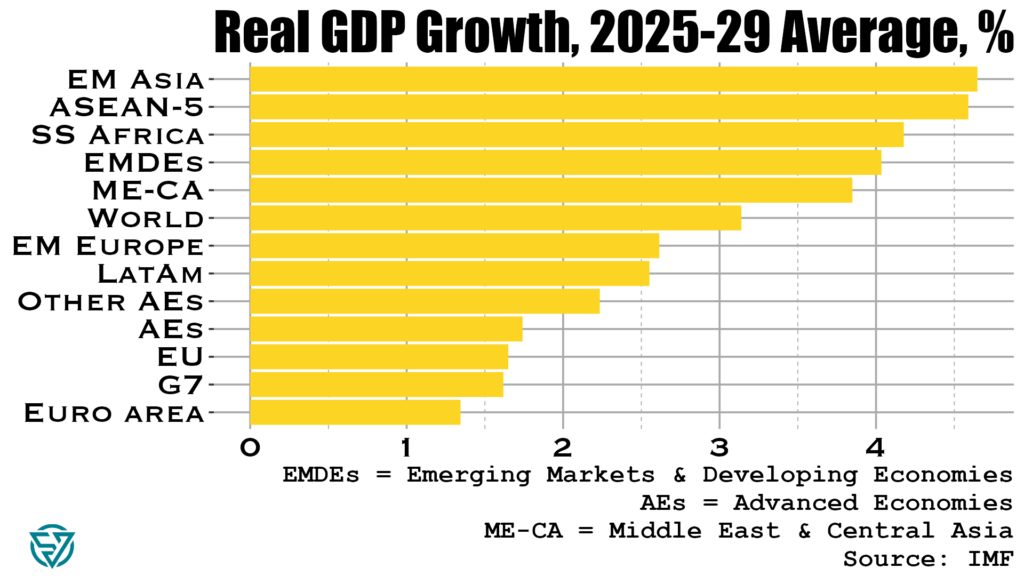
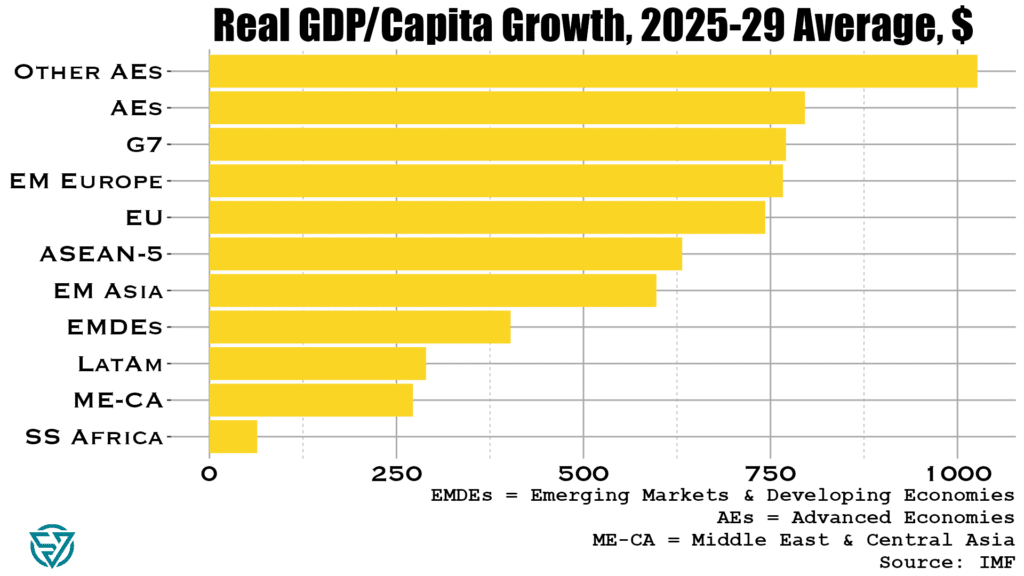
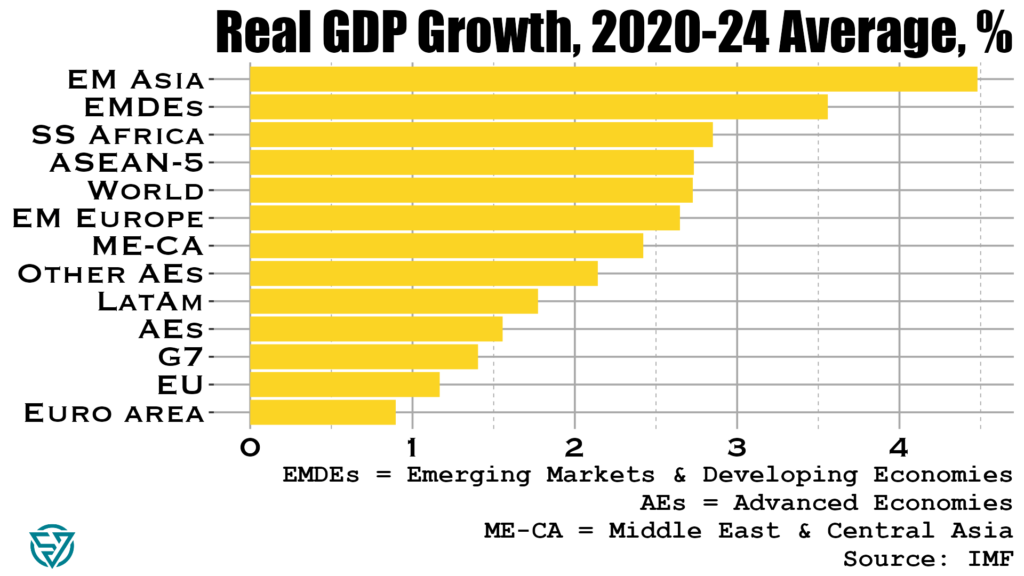
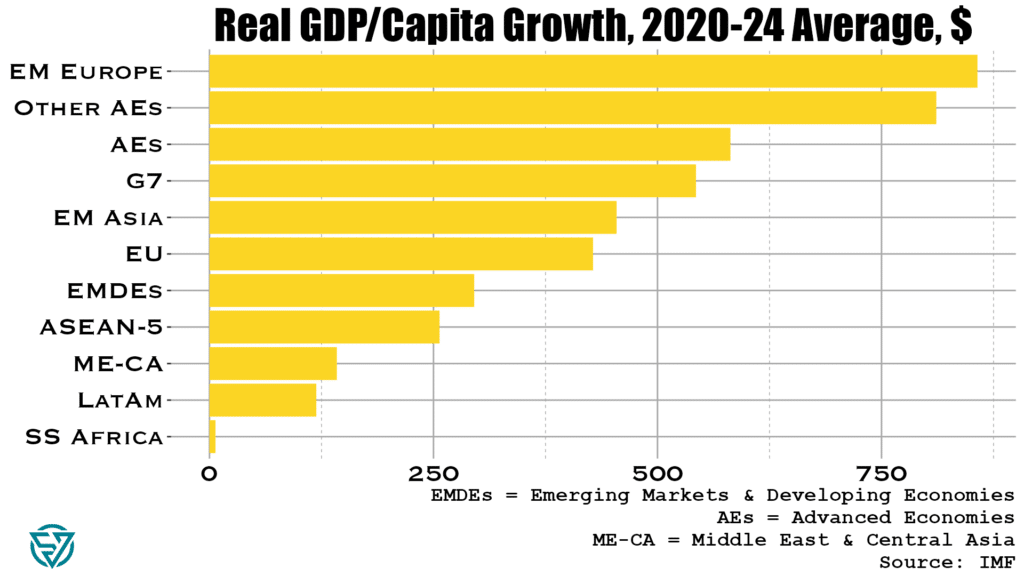
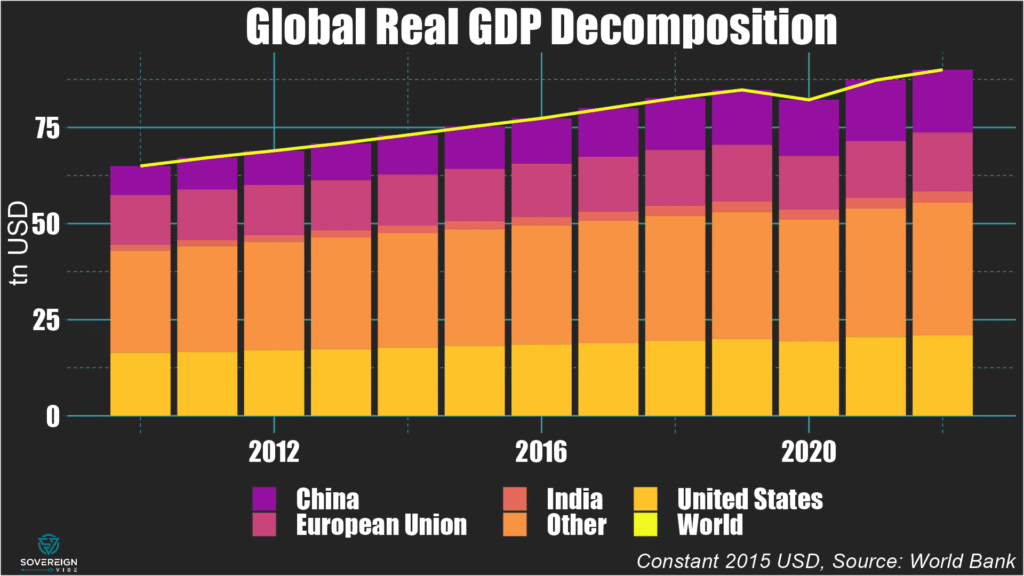
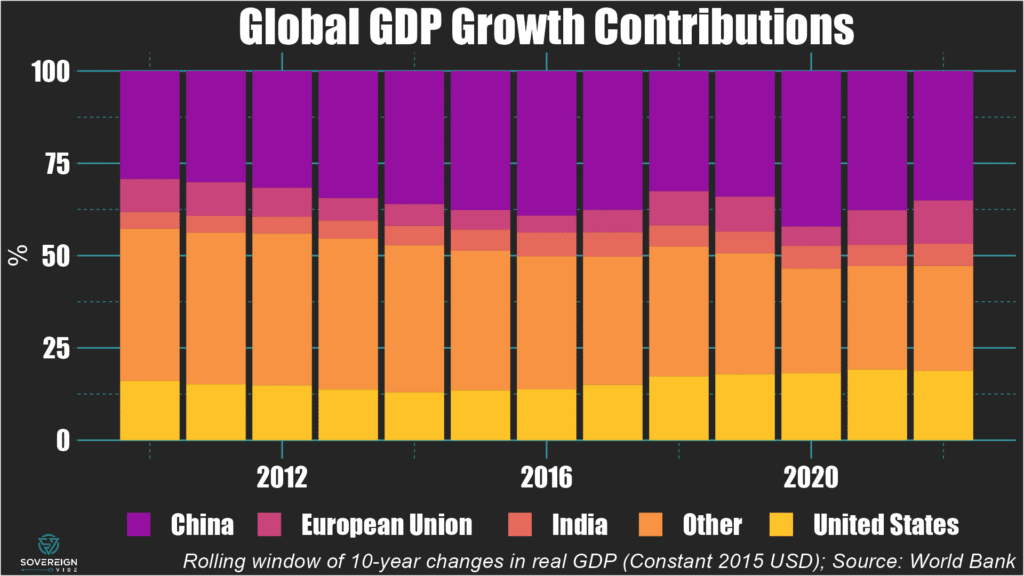
The charts below break down export exposure by region:

Fed rate-cutting

The conditions were supposed to be favorable to emerging markets.

The beginning of a Fed rate-cutting cycle is reliably a good omen for the EM universe.

Lower U.S. yields mean lower yields for EM debt, especially if it is dollar-denominated.

While lower borrowing rates for EMs assumes spreads remain somewhat steady when U.S. rates are lower, in any case the effect of lower U.S. rates helps drive capital flows towards EM.

Trump trades in full swing

But Trump’s victory has just blown that narrative out of the water.

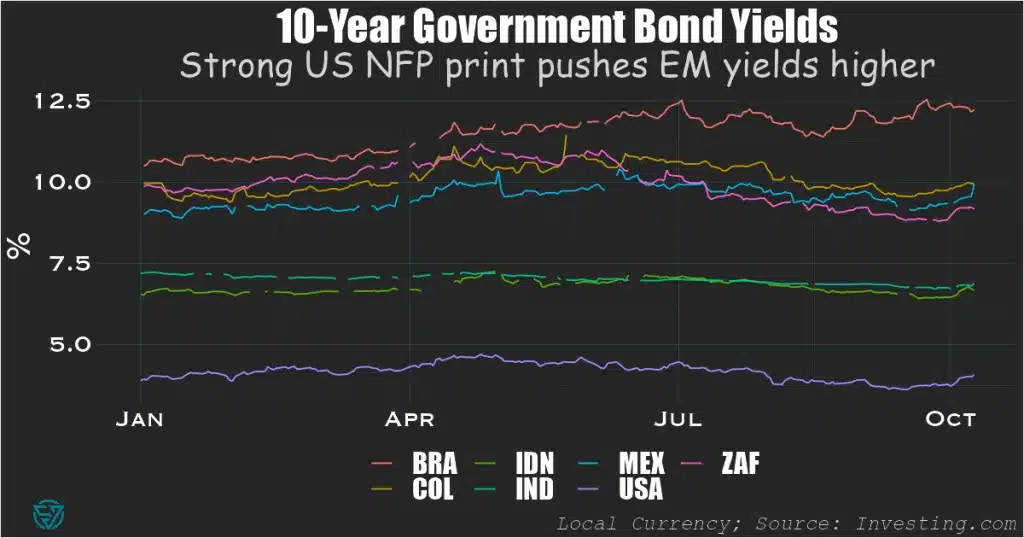
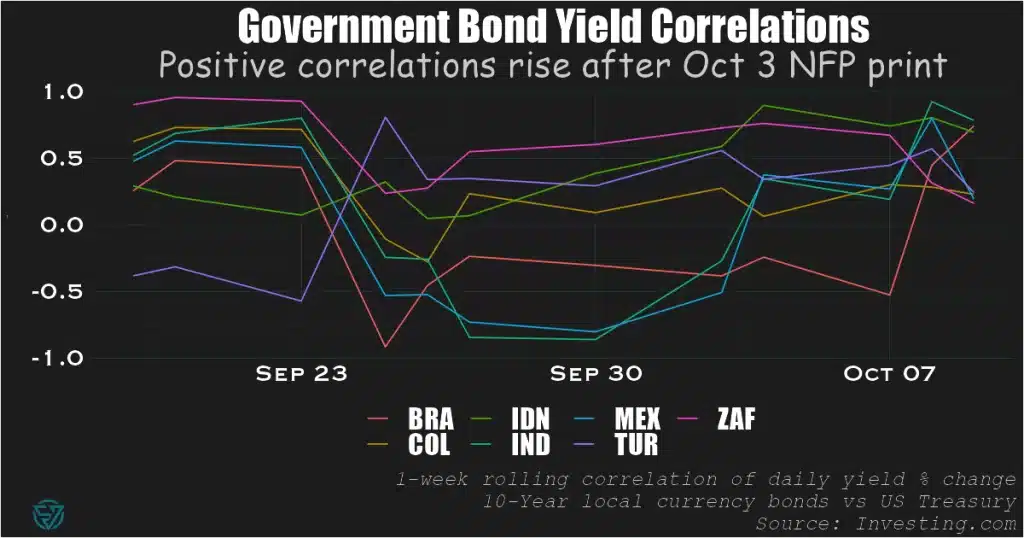
Sure, U.S. yields were already rising in October on the back of strong non-farm payroll data and robust economic growth, though this was tempered by weak jobs data late last week.

Yet the market reaction has pushed U.S. yields up further across the yield curve, in a bear steepening, which sees long-term rates rise fastest.

This means that markets expect increases in:

  • nominal growth & inflation: as a result of lower taxes, higher spending and higher fiscal deficits.
  • uncertainty: due to policy volatility, including on trade tariffs, hence the higher term premium at the longer end of the curve.

Meanwhile, other “Trump Trades” are in full swing: U.S. stocks, the USD, and Bitcoin are all up.

EM under pressure

In this new higher-U.S.-yield, stronger-USD environment, EM currencies have taken a battering in the immediate aftermath of the election result.

The broad EM currency index registered its largest daily loss since early 2023, with the Mexican peso and Eastern European currencies suffering.

Asian equities pulled down the MSCI EM equity index by 0.7% on November 6th, as market participants evaluated the impact of Trump’s tariff policies.

Hong Kong equities dropped by some 2.5%.

Categories
Emerging Markets Macro

Which emerging markets have an inflation problem?

Rampant inflation is most prevalent in lower-middle income countries, except for Argentina and Turkey.

A recent piece by the ex-head of EM economics at Citi, David Lubin, ponders inflation risk in emerging markets, citing fiscal indiscipline as a major threat to price stability.

So I wanted to visualize cross-country IMF forecasts for EM inflation in 2024 and juxtapose that to see how it tracks with what Lubin is saying.

He mentions South Africa (~4.5%) and Hungary (3.7%) as success stories in reining inflation in to target. In contrast, Lubin notes that Brazil (~4%) and Turkey (~60%) have fiscal policies that are too loose.

Though I would add that South Africa didn’t exactly implement an austerity program in the run-up to its general election in June.

The Fed’s easing cycle and increasing Chinese market share in global exports are both disinflationary forces for EMs, whose battles against inflation could benefit from these benign external forces.

Upper-middle income EMs

In the upper-middle income group of EMs, South Africa and Brazil hardly stand out as particularly successful or unsuccessful in tackling inflation, respectively. Not least because the former has higher inflation numbers than the latter.

Lubin is of course right about Turkey being too expansionary in its fiscal policy, with a potential crisis brewing. According to Lubin, on the monetary front, one issue is that the central bank is under too much pressure to maintain exchange rate stability.

While inflation remains reasonably low in Mexico, Lubin is right to point out the fiscal discipline risks in Mexico, given early indications of new president Claudia Sheinbaum’s policies.

Argentina is in the reverse situation compared to Mexico, with already-rampant inflation (250%!) but leadership that has balanced the budget.

Lower-middle income EMs

Unsurprisingly, inflation is much higher in this poorer sample of countries. Only a handful have inflation rates below 5%.

Lubin notes that fiscal discipline is a risk in Indonesia, though it does have one of the lowest inflation levels in this category.

Though I am surprised to see that Indonesia – and India – are lower-middle income. I’d had them pegged as upper-middle income, given their prominence in the EM universe.

Let’s chalk that up to how confusing the EM asset class is. I get that both countries have large populations, but I thought they would have “emerged” more by now. Thankfully, growth is strong in these two Asian nations.

High income EMs

Overall inflation rates are much lower in this group. Romania comes in highest, at a mere 6%.

These are truly developed-country CPI readings, providing yet more reason to abandon the EM designation altogether. Many of these countries have little in common with each other.

Lubin points to potential fiscal indiscipline risks in Poland, which indeed has higher inflation than a more “successful-according-to-Lubin” Hungary.

Categories
Emerging Markets Sovereign Debt

Volatile US Treasuries spell trouble for emerging market debt

The Fed’s data-dependence is clouding EM’s mostly-benign cutting cycle outlook.

Investor expectations of Fed policy and the resulting impact on US Treasury yields is increasingly affecting emerging market debt, as markets lurch from one narrative to another in response to data releases.

Volatility in the US Treasury market has surged since last Friday’s blockbuster US non-farm payrolls report, with investors expecting the Fed to slow the rate-cutting cycle.

The strong print dashed hopes of a second large cut at the Fed’s meeting in November, which had risen in the wake of the landmark 50 basis point decrease on September 18th.

This reversal sent US 10-year Treasuries above the 4% mark, while also placing upward pressure on EM local currency yields so far in October.

This month, ten-year yields are trending higher in India, Indonesia, South Africa (despite a recent rate cut), Mexico, and Colombia. Only Brazil has seen its long-term borrowing costs decline, although these remain elevated.

Mixed picture: today’s US macro data release

Today’s US data release of headline CPI declining to 2.4% in September could place upward pressure on US Treasury yields, as it was above the consensus forecast of 2.3%.

Moreover, core inflation also came in above economists’ expectations, at 3.3%.

On the other hand, US unemployment insurance filings beat the forecast number by 30,000, having risen to 258,000. This is the largest weekly increase this year, supporting the case for monetary policy easing.

In early trading, the two-year Treasury yield has remained stable, at slightly above 4%.

EM and Treasury yields are tightly correlated

Since August, EM sovereign yield correlations to US Treasuries have increased.

Looking at this relationship over a three-month rolling window, this tighter link has benefited EM government issuers.

Indeed, their borrowing costs were declining until end-September, except in the case of Brazil (see first chart above).

And since October 3’s large NFP figure, all seven in-sample EMs have seen their weekly yield correlations to US Treasuries turn positive.

Moreover, 10-year local currency government bonds in Brazil, India, and Indonesia have recorded positive weekly correlations with 10-year Treasuries of 0.75 or above.

Categories
Emerging Markets Sovereign Debt

Sri Lanka Election: Any Port in a Storm

Markets cautious on newly-elected President Dissanayake, renegotiations.

In one of Sri Lanka’s greatest political shake-ups in decades, this weekend’s presidential election saw the victory of neo-Marxist Anura Kumara Dissanayake ahead of the country’s two main, established parties.

With the political establishment now swept away, Dissanayake now faces the arduous task of consolidating the economic recovery and setting public finances on a sustainable, growth-inducing trajectory. 

Political Thunderbolt

Markets have had a mixed reaction to Anura Dissanayake’s victory in Sri Lanka’s presidential election over the weekend.

The bond market reaction has been fairly predictable for the election of a neo-Marxist, with Sri Lankan government yields sent soaring. 

There are concerns that Dissanayake’s neo-Marxist leanings will lead to renegotiations of provisional debt restructuring deals and may even call some IMF conditionality into question.

Yields are also up over market uncertainty around how the new president and his party will govern, and whether that will threaten reform momentum.

The situation is fluid, with Dissanayake having dissolved parliament yesterday, where his party only holds three seats.

An End to Corrupt Rule?

There are some reasons to be hopeful. Local equities have been rising this week.

This could be related to the potential end to corrupt rule in the country and, with any luck, a pivot towards more transparent, inclusive governance and the stability that brings.

President Anura Kumara Dissanayake; Eranga Jayawardena/Associated Press

It’s easy to forget that what matters for governance is inclusivity, rather than focusing excessively on the left-right political spectrum.

The deeply-corrupt Rajapaksa dynasty was more market-friendly than Dissanayake on the surface.

But it was the endemic clientelism under their rule that led the country over the brink of default.

More than anything, this electoral result has been the repudiation of long-standing patronage networks.

As such, it should give investors hope for improved macroeconomic stability and public financial management.

If Dissanayake and his team manage to avoid measures that are excessively punitive for investors and businesses, including SMEs, brighter days may well be ahead for Sri Lanka and its stakeholders.

A Silver Lining to Renegotiations?

Moreover, there could be a silver lining to revising provisional debt restructuring agreements.

The bondholder deal is problematic as it is, as the macro-linked bonds will increase Sri Lanka’s future coupon payments if nominal dollar GDP rises beyond a certain threshold.

The macro-linked instruments are supposed to reflect strong growth.

But merely a strong currency appreciation that pushes GDP in nominal USD above the threshold, rather than rising output, could trigger the step-up.

Categories
Emerging Markets Macro Sovereign Debt

Is the Washington Consensus Dead?

Small island states and large emerging markets have the biggest budget deficits in 2024.

So this week I wanted to take a quick look at how our beloved emerging and frontier markets compare fiscally .

In today’s newsletter I’m only showing you overall budget balances as a starting point. This is part of a larger deep-dive cross-country fiscal comparison that I’m working on.

As I’ve done previously, I segment the countries by income level, into upper-middle and lower-income groups. Here I rely on the IMF’s World Economic Outlook April 2024 database, using the forecasts for the current year.

Small Island States & “Big EM”

The first thing that stands out when comparing the upper-middle (first chart) and lower-income (second chart) country groups is that “only” one UMIC – the Maldives – has a budget deficit at or below -10%/GDP.

In contrast, five LMICs – Timor-Leste, Kiribati, Ukraine, Egypt, Zimbabwe – are at or below this threshold.

No wonder the Maldives is currently on the hunt for a bailout to avoid the first-ever sovereign default on an Islamic bond.

And taken together, these charts both underscore the frailties of small-island states. In addition to the ones mentioned above: St. Vincent, Tonga, Fiji, and Vanuatu also have yawning budget deficits.

The Washington Consensus

These lists are also noteworthy for the presence of large deficits in large emerging markets keen to use their borrowing power. Chief among them is China at -7.4%/GDP, followed by Brazil, South Africa, Mexico, and Turkey.

Though by now it’s fair to say that the Washington Consensus principle of fiscal discipline is effectively dead, with the US on track to run a -7%/GDP fiscal shortfall this year.

Among large emerging markets, only China is more profligate. Unlike the US, however, it is trying to spend its way out of an economic slump.

So for any countries out there in need of an IMF program, the message is “do as I say, not as I do” when told to rein in their government spending.

A Positive Note?

Not really, unless Jamaica or a chainsaw counts. The countries that run fiscal surpluses have one or more of the following characteristics:

  • Mineral wealth: Equatorial Guinea, Libya, Turkmenistan, Republic of Congo, Angola, Turkmenistan, Mongolia
  • Small islands with no borrowing power: Haiti, Lesotho, Tuvalu, Palau, Grenada, Micronesia, São Tomé and Príncipe
  • Fiscal discipline: Jamaica, Argentina
Credit: AP Photo/Natacha Pisarenko
Categories
Emerging Markets

Where is emerging market growth fastest?

EM convergence to rich-world wealth levels is concentrated in Europe and Asia.

When I read a recent piece by Ruchir Sharma about a growth revival under way in emerging markets, I had to start investigating.

Apparently, a higher-than usual proportion of EMs (88%!) will have GDP per capita growth higher than the US in 2025-29, if IMF forecasts are anything to go by.

It seems that raw materials exports for green tech, an AI-related boom in chips and electronics, and ongoing re-shoring/friend-shoring of supply chains will be major drivers of EM resurgence. And that could well be.

My own view is that the winners and losers will be differentiated by which countries manage to move up value chains to the export of services and manufactured goods rather than natural resources.

That’s simple economic reasoning and far from contrarian. But it goes against the “Africa Rising” or “African Century” narrative that I so often hear.

Expect EM Asia ex-China, including India and ASEAN, to do continue doing well over going forward, though China will no longer be a main driver of that growth story.

EM Europe has also been overlooked as a bit of a dark horse but has posted some impressive wealth gains in recent years. And it’s poised to develop further.

For Africa, LatAm, and the Middle East & Central Asia, the future is somewhat cloudier. I’d even go so far as to say that I’m pessimistic on wealth creation keeping pace with breakneck demographic growth in Africa.

I’ve prepared some charts to help you visualize how the IMF’s data describes the past, present, and future of world regions in terms of:

  • average annual GDP growth; and
  • average annual GDP/capita growth, in purchasing power parity-adjusted constant 2017 US dollars.

2025-29: Looking Ahead

The charts below show how emerging economies in Asia, including ASEAN, are poised to grow quickly over the next five years. The outlook also seems promising for Africa and for emerging markets as a whole.

Conversely, the IMF forecasts weak GDP growth for advanced economies. Slow growth is nothing new in Western Europe, but a sluggish G7 points to a slowdown in the US economy.

This could well be, given currently-large US deficits are draining future resources for productive investment.

On the GDP per capita metric below, Africa is dead last in the IMF’s forecast.

Sure, since the levelof GDP per capita is lower in poor countries, a small dollar change is actually larger in percentage terms in Africa than the same dollar amount would be in a richer country.

Still, these GDP per capita numbers are adjusted for purchasing power and for inflation.

So a less-than-$100 increase in income annually on average over the next five years is abysmal, especially given the importance of combating poverty and migration crises.

The per capita GDP growth forecast also looks lackluster for the Middle East, Central Asia, and Latin America.

On the other hand, advanced economies and EM Europe look poised to benefit from the most average annual dollar wealth creation.

2020-24: The Pandemic & Its Aftermath

The past five years have have been rough, with the global economy suffering from the polycrisis of the Covid-19 pandemic, surging inflation, and conflicts in Ukraine and the Middle East.

Advanced economies, and especially Europe, have had the weakest average annual GDP growth, along with LatAm.

While it comes as no surprise that to see EM Asia at the top of the 2020-24 GDP growth list, EM Europe topping per capita GDP growth is surprising, given the war between Russia and Ukraine.

Africa managed nearly 3% average GDP growth during this period, so the continent is actually developing. But it is not doing so quickly enough to outpace its demographic boom, which is why it ranks last once again on GDP per capita growth.

It has been a challenging five years for most EM regions in terms of per capita GDP growth, while advanced economies have fared well.

2015-19: Looking Back

The latter half of the 2010s share some similarities with 2020-24:

  • EM Asia and ASEAN posted strong headline GDP growth.
  • All advanced economies experienced strong GDP/capita growth.
  • Africa and LatAm – and, to a lesser extent, the Middle East & Central Asia -fared worst on GDP/capita growth.
Categories
Emerging Markets

Right-wing populism on the rise in EM

2024: string of electoral victories for right-wing populists across emerging markets

Right-wing populism

In order to help you EM aficionados cut through the political news cycle noise, it’s necessary take a step back and think about the direction of travel of EM politics. Let’s not bury the lede: by my count, the political winds in 2024 are favoring populist right-wing parties above all else.

That’s not to say other political formations haven’t done well this year. Center-left parties are a case in point. As are authoritarians of different stripes.

But it is noteworthy that right-wing populists have enjoyed electoral victories across most EM regions year-to-date:

  • Europe: Slovakia, North Macedonia, Bulgaria, Poland
  • Asia: Indonesia, India
  • Latin America: Panama

Some caveats

The main center-left victories have come in Taiwan, Turkey, South Korea, and Mongolia. Mexico and South Africa also witnessed victories of left-wing populists with wide-ranging implications.

Now, victory does not equal improvement. For instance, India’s BJP and South Africa’s ANC “won” their general elections but secured far fewer seats than anticipated. In the latter case, the winner even had to enter into a coalition with rival party to form a government.

Authoritarians

For the authoritarian “victories” listed below, these have all come in various forms. The Awami League’s re-election in January has proven short-lived, with protests ousting the government in summer 2024.

The electoral situations in Venezuela, Chad, and Pakistan have their own idiosyncrasies but share at least one attribute: the results are anything but free and fair.

And the Kuwaiti emir’s penchant for dissolving and re-dissolving parliament is down right bizarre. Maybe he is competing with Bulgaria to host as many elections in short order as possible?

Where is the center-right?

Another feature of this year’s electoral results in EM is the seeming absence of any center-right victories.

There could possibly have been a few. But I haven’t gone through every single contest, having filtered for broadest possible relevance to the EM investor base (e.g. sorry Iraqi local elections, Madagascar parliamentary elections, Vanuatu constitutional referendum etc).

This could be a naming issue: are all so-called right-wing “populist” parties actually more “populist” than so-called center-left parties not branded as such?

Overview

Right-wing victories

  • Center-right: NA
  • Populist: Slovakia, North Macedonia, Bulgaria, Indonesia, Panama
    • Victory but weakened: India, Poland
  • Authoritarian: Pakistan, Kuwait, Chad

Left-wing victories:

  • Center-left: Taiwan, Turkey, South Korea, Mongolia
  • Populist: Mexico, Senegal
    • Victory but weakened: South Africa
  • Authoritarian: Bangladesh, Venezuela

April

Kuwait: Kuwaiti politics have been downright chaotic of late, with the emir having dissolved parliament in February following an alleged insult. This fourth election in four years resulted in the opposition retaining its majority, at least until the emir dissolved parliament – again – in May.

Slovakia: The populist, pro-Russian PM Robert Fico’s preferred presidential candidate, Peter Pellegrini, won the run-off for the largely-honorary role. Fico survived an assassination attempt in May, marking deep divisions within the country.

Poland: The nationalist, opposition PiS party came out ahead in local elections on April 7th, remaining the strongest party. But Prime Minister Tusk’s Civic Coalition experienced some gains, notably with more majorities in regional assemblies.

South Korea: The center-left DPK retained its hold on the most seats in the National Assembly and with its partner parties in the Democratic Alliance controls an absolute majority of seats. Its historic rival, the conservative PPP, holds the presidency.

Other: Croatia, Solomon Islands, Ecuador, Maldives.

May

South Africa: The ruling ANC party lost its outright parliamentary majority for the first time in the post-apartheid era. President Ramaphosa chose to enter a new coalition government with the center-right Democratic Alliance, a long-time rival party.

Panama: The center-right Realizing Goals-Alliance won the vote, bringing José Raúl Mulino to the presidency. Mulino has expressed skepticism around allegations detailed in the Panama Papers surrounding a variety of corrupt business practices allegedly facilitated by a local law firm.

North Macedonia: In a blow to the country’s EU integration prospects, the nationalist, right-wing party VMRO-DPMNE decisively won the parliamentary elections while its candidate, Gordana Siljanovska-Davkova, won the presidential elections on the same day.

Chad: Following the death of long-serving then-President Idriss Déby in 2021, his son Mahamat Déby served as transitional president until the 2024 election. Déby then won the vote handily, in results that have been heavily disputed and overshadowed by the killing of one of the candidates prior to the election.

Other: Lithuania, Dominican Republic, Madagascar, Vanuatu

June & July

India: Narendra Modi’s Hindu nationalist BJP unsurprisingly won the general election, albeit by much less than previously anticipated. So much so that this came as a shock, with expectations that the BJP would win 400 seats instead of the 240 that it managed to secure.

Mexico: Claudia Sheinbaum of the center-left Morena party, founded by outgoing President AMLO, is the first woman to be elected president in Mexico.

Venezuela: Incumbent President Nicolas Maduro was re-elected in an election whose results are heavily disputed.

Bulgaria: The center-right GERB party secured the most votes in this snap election, the country’s sixth in three years. But with only around a quarter of the seats, this result failed to end the country’s political instability, with parties failing to form a government, and leading to new parliamentary election in October 2024.

Mongolia: The incumbent social democratic MPP secured a reduced, narrow majority in parliament.

Other: Iceland, Serbia, Ireland, Belgium, Iraq, Mauritania, Rwanda

Looking Ahead

September: Sri Lanka, Algeria, Romania, Switzerland

October: Mozambique, Lithuania, Georgia, Uruguay, Chad

November: United States, Palau, Somaliland, Switzerland, Mauritius, Guinea-Bissau, Namibia, Romania

December: Ghana, Romania, Croatia, South Sudan

Categories
Emerging Markets

Egypt: short-term pain, long-term gain

Famous last words, but this time could be different.

Big things are happening with Egypt’s economic policy management, and investors are taking notice. Though as with any other emerging market, the question that shouldn’t be asked is so often the same: is this time different? One of the most obvious symptoms of change is the major devaluation of the Egyptian pound, which slid from around 30 to the dollar to nearly 50 in early March.

Good news

Two major announcements for Egypt this year have been game changers in terms of easing FX payments pressures on the country. The first is a $5 billion increase in the IMF’s Extended Fund Facility to $8 billion, a clear vote of confidence by IMF staff over economic policymaking. The second is a blockbuster deal with Abu Dhabi-based ADQ to invest $35 billion in Ras El Hekma on Egypt’s Mediterranean coast, equivalent to about 7% of the GDP and planned for rapid disbursement.

This is all terrific news but will only matter in the long term if the government gets its economic policies right and restores macroeconomic balance sustainably. Clearly, the authorities are making strides towards a more flexible exchange rate regime. However, this is the sixth devaluation since the start of 2016, so observers should also temper their expectations regarding the authorities’ commitment.

Yet the devaluations in 2022 are already having a positive impact. Using Sovereign Vibe’s dashboard of sovereign stress indicators, the current account balance (CAB) deficit has been narrowing:

Diving in to more detail on how the 2022 devaluations have been helping Egypt bring its CAB back towards positive territory, taking a look at the underlying CAB is helpful. A crucial component of Sovereign Vibe’s broader fair value currency model, the underlying CAB is the CAB adjusted for the lagged effects of:

  • real exchange rates changes,
  • the domestic output gap, and
  • the trade-weighted foreign output gap.

Egypt’s 2022 real devaluations had a small impact in 2022 and a large one in 2023 on trade volumes and trade prices. These always respond in the opposite way to REER changes. As seen here, a decrease in the REER (i.e. a devaluation) causes a positive volume effect on the CAB (chiefly via higher net exports) and a negative price effect on the CAB (via higher import prices). Crucially, the relevant literature finds that the volume effect outweighs the price effect. This is all good news for Egypt.

Short-term pain, long-term gain

Here is some REER data through February 2024, right before Egypt’s massive devaluation this year. As you can see, the inflation differential with its trading partners was already skyrocketing:

Inflation is indeed running rampant, with the IMF projecting it to exceed 30% over the course of 2024. This is of course extremely harmful to ordinary citizens who are seeing their purchasing power eroded. In response, the Central Bank of Egypt has taken the sensible step of increasing its policy rate significantly, by at least +800 basis points in Q1 alone. Unfortunately, growth has also been slowing since a post-pandemic rebound in 2022.

Public sector profligacy, private sector exclusion

At only 30% of GDP, Egypt’s credit to the non-financial private sector (i.e. households and non-financial corporates) is significantly lower than in most other EMs. As such, it’s necessary to direct more credit towards the private sector, and this corresponds to the structural reforms the government is undertaking with IMF support. One change under way relates to eliminating preferential tax incentives for state-owned enterprises.

Egypt is a clear-cut case of public sector borrowing crowding out credit to the private sector. In other words, the government borrows so much that there isn’t much credit left over for firms and households. SOE tax breaks are only one symptom of this. The bigger picture is that the government has been running budget deficits in excess of 5% of GDP since 2008. All that net borrowing has caught up to the government, as net interest payments have grown markedly.

The primary budget balance, which excludes net interest payments on debt, has actually been positive since 2019. In 2024, the gap between the overall and primary budget balances is projected to be ~15% of GDP. This gap is equal to net interest, suggesting net payments of around $70 billion this year. For comparison, Egypt’s official international reserves stood at only ~8% of GDP in 2023, though these are no doubt increasing substantially in 2024 amid the IMF and ADQ disbursements.

Silver lining

So the policy prescription is quite clear: re-direct resources and credit from the wasteful public sector to the private sector and unleash its productive potential. Increasing lending to the private sector, or any sector, is challenging amid monetary policy tightening, which Egypt is currently going through in its battle against inflation, but must be the medium- and long-term plan.

If the authorities can get it right, the Egyptian economy’s best days should be ahead of it, as the demographic trends are evolving favorably. The government has succeeded in bringing the birth rate down from 3.5 to 2.85 per woman in the past five years, which is converging towards the replacement rate of 2.1. In this country of 105 million, youth unemployment will likely remain a challenge in the short- and medium-terms, but these pressures should abate over the long-term ceteris paribus.

The 2024 devaluation, for all the short term pain via exchange rate inflation pass-through, should help unlock export-oriented opportunities for the economy and thus stoke growth, decrease unemployment, and put the government on an improved budgetary footing.

Categories
Emerging Markets

The Modi mojo is working

India’s economy is in great shape as it heads to the polls… but something’s off.

With India’s general elections getting under way on Friday, much of the focus this week will be on the world’s most populous country and largest democracy. So here are some charts to help you look beyond the headlines and arm yourselves with some facts.

Modi’s mojo

South Asia is the fastest-growing of all emerging market and developing economy regions, largely thanks to robust growth in India on the back of strong public investment and dynamic services.

Growth rebounded strongly thanks to a post-2020 base effect, breaching 9% in 2021 before moderating to ~7+% in 2022 and ~6+% in 2023 and 2024. These are excellent numbers, particularly given that inflation is gradually declining towards the Reserve Bank of India’s 4% target. All of this situates growth and inflation above and below their averages since 2010, respectively (see chart below). So it is little wonder that Narendra Modi’s BJP is so strongly positioned as India heads to the polls.

A global perspective

Zooming out, India’s population is still heavily under-represented in the global economy. Its 1.4bn+ souls account for nearly 18% of the world’s total, while its share of global GDP is only a bit above 3%.

Yet the country is certainly punching above its weight when it comes to contributions to global GDP growth, as it is contributing 6% of global growth (see chart below) from its 3% slice. This ratio is likely to evolve favorably for India in coming years as China’s growth continues to slow.

Demographics

The pyramid below has an ideal shape for economic growth in India over the next decades. A huge cohort of young people – the world’s largest – is moving into the workforce, even as birth rates moderated over the past couple of decades. This will decrease the dependency ratios of the young and old on people of working age and likely contribute strongly to growth, savings, and development in the years ahead.

However, it is concerning to see such a large imbalance between the number of men and women in India, with men far outnumbering women. The gap is as wide as 2 million for each age for people in their 20s and 30s. It is estimated that there are around 106.5 men for every 100 women in the country. This is the type of ratio that could potentially lead to instability and violence under certain conditions, though hopefully India’s robust output growth can continue to be somewhat of a palliative to that.