Categories
De-dollarization

The dollar-debt imbalance

One of the major announcements at last week’s World Bank/IMF Spring Meetings concerns the unsustainable rise in US government debt. While it’s old news that the budget deficit is large – $1.7tn / 6.3% of GDP in 2023 and a projected $1.6tn in 2024, I want to highlight how US debt relates to the the role of the dollar internationally. Besides, the Springs also mean there is new IMF WEO data to play with:

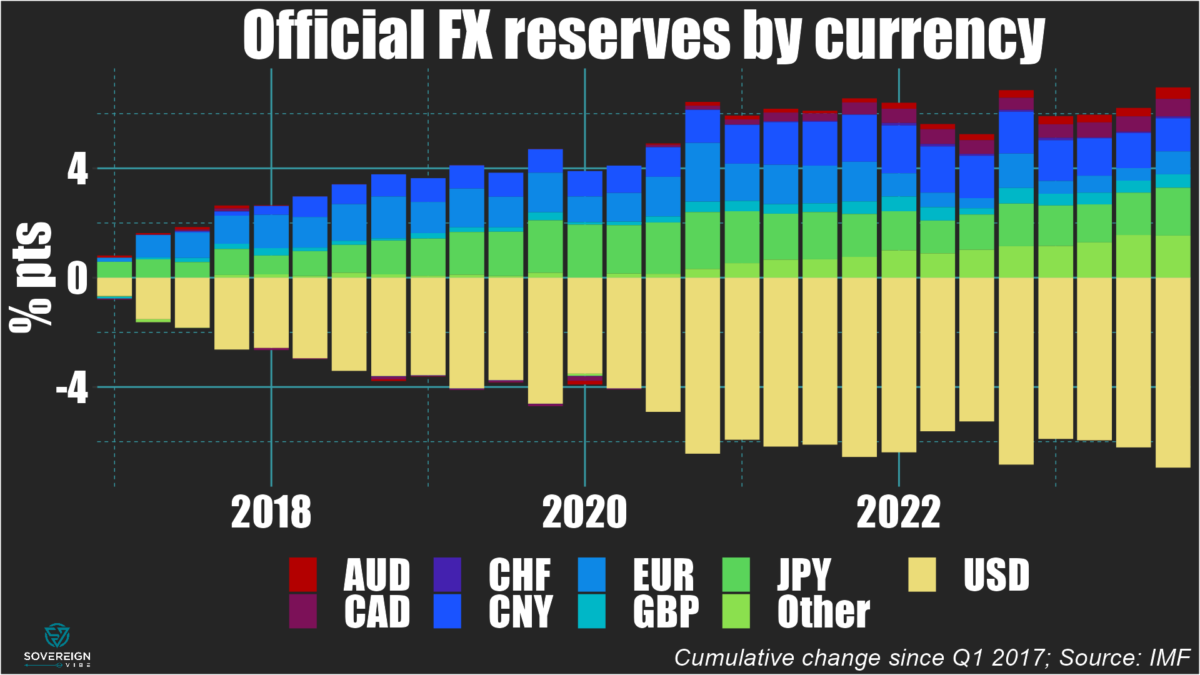
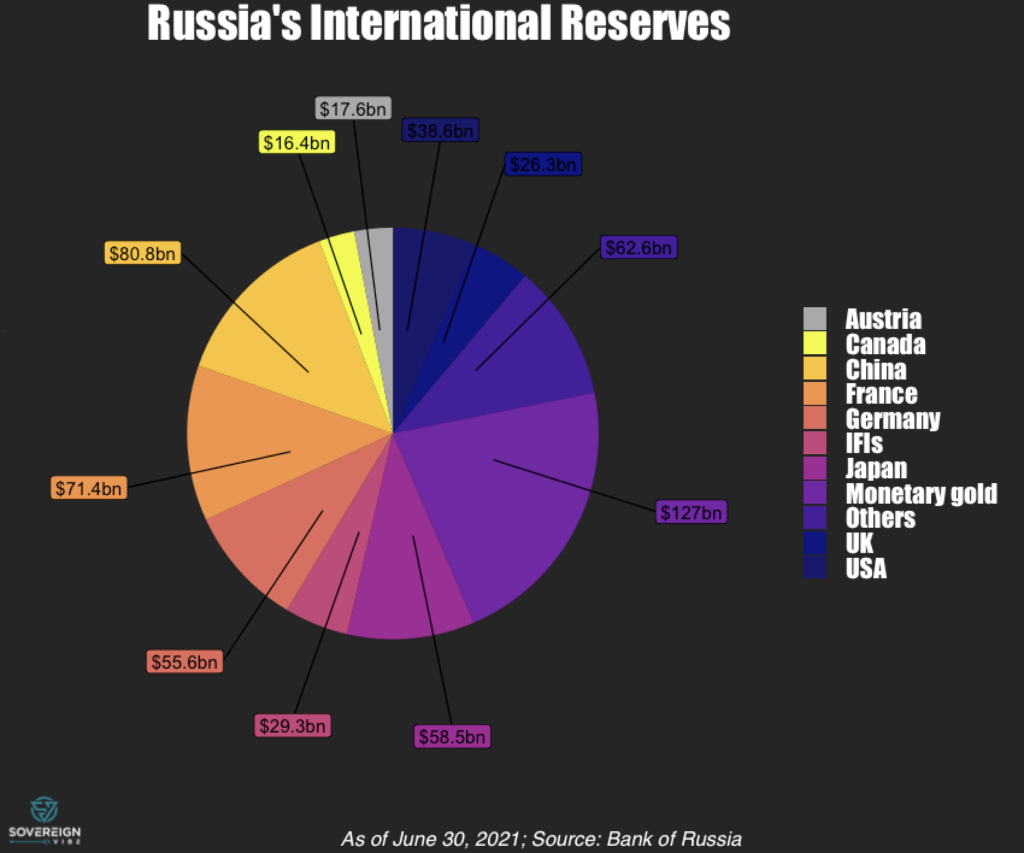
De-dollarization has become a hot topic in recent years, with many observers siding ideologically “against” the USD, e.g. Brazil’s president Lula asking why international transactions should occur in dollars. Many also claim that the yuan and other BRICS currencies are rising in importance. While it’s true that RMB is playing a greater role in trade invoicing and international reserves, this increase is limited to either specific countries (e.g. Russia) or has been less than the rising prominence of other G7 currencies.

Yet such grandstanding belies ignorance of why the greenback is so dominant. China scholar and Carnegie Endowment fellow Michael Pettis explains this with his usual brilliance.

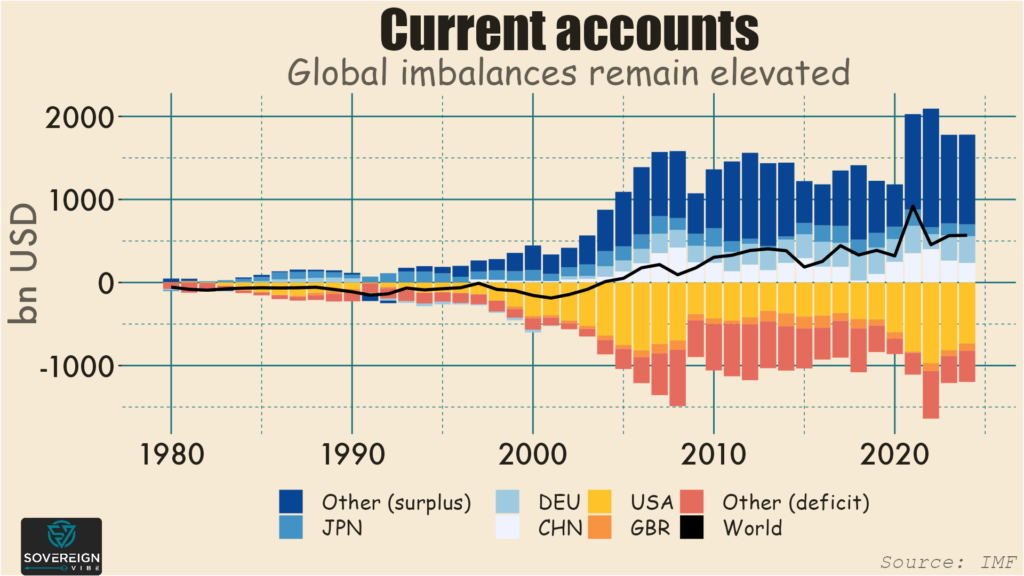
Essentially, countries that run current account surpluses – (remember that the current account is the trade balance plus other sources of foreign income) – are subsidizing manufacturing. China and Germany are prime examples.

In contrast, deficit countries are subsidizing consumption. The US and – to a much lesser extent – the UK have the largest average current account shortfalls in dollar terms.

One way to think about current accounts is that they are equal to savings minus investment, on a national level. Savings is of course the difference between income and consumption. So, when a country has a positive current account balance, it is saving more than it is investing. The reverse is true for CAB deficits:

Current Account Balance = Savings - Investment

It follows that for a current account to rise, savings increases and/or investment decreases. For a current account to decline, savings decreases and/or investment increases.

Capital account

Another important piece of the puzzle is the capital account, which is open in the US and other G7 countries, but not in China. Investors understandably prefer to send their capital to countries with strong property rights, institutions, and rule of law. These robust investor protections is one of the reasons why the US and the UK and, to a lesser extent, Canada and Australia have such large deficits.

In other words, in countries with open capital accounts, when net international capital inflows are positive, the balance of payments means that the current account has to be negative (barring some potential temporary effects via international reserves dynamics).

Transfers, both internal & external

Surplus countries such as China, Germany, and Japan subsidize manufacturing at the expense of domestic consumers. Low interest rates and low wages, in China and Germany’s cases at least, result in net transfers from savers (i.e. households and workers) to manufacturing firms. Along with their manufactured goods, they are also “exporting” weak domestic consumer demand to other countries.

To resolve this external imbalance, deficit countries like the US and UK have to either decrease savings and/or increase investment. But, with companies either holding large cash balances or using them to buy back stock, there seem to be few signs of increasing investment. This means that savings must be negative. This can occur via increased unemployment, but, to avoid this, the government instead subsidizes consumption (at the expense of manufacturing) via increased household and/or government debt.

As such, exploding US government debt is partly a result of these external trade imbalances. This begs the question why the US accepts an undervalued yuan and large negative trade deficit with China, though the White House has certainly pushed back against this arrangement at various points.

Narrow interests

As is often the case, the status quo is a result that serves a specific set of narrow interests. With the US running such a large current account deficit, other countries acquire US financial assets denominated in dollars, meaning that the US exports its financial assets to the rest of the world. Doing so ensures the dollar’s status not only as a store of value but also as a medium of exchange internationally, which is what gives the US government power to levy financial sanctions and US banks power to dominate transactions.

Yet this situation is neither sustainable for the US government and households, nor is it desirable for most Americans. Even disregarding the overuse of sanctions, the effects of USD prevalence are negative abroad as well. For instance, greenback dominance has generally resulted in a strong dollar, which is not beneficial for global trade.

Unsustainable status quo: here to stay?

In fact, the global trading system works terribly. Ideally, wealthy countries would run surpluses, and EMDEs would run deficits in order to funnel rich-world savings towards domestic investment. But EMDEs present a variety of risks to investors, who prefer to have higher allocations to safer countries, e.g. the Anglosphere.

It is not the yuan or some other currency that will dislodge the dollar. Rather, it would be some combination of push and pull factors outside and inside the US. China and other surplus countries could stop incentivizing manufacturing and instead increase consumption and, in some cases, investment. US policymakers could reduce fiscal and household debt accumulation while encouraging exports of goods and services.

In both the surplus and deficit cases, restoring that balance between consumption and manufacturing would have broad-based economic benefits. Unfortunately, the prospects for either of these outcomes seem remote because of the political priorities of Beijing’s surplus maximization and of Washington’s dollar weaponization, both of which are cornerstones of this deglobalizing era. Yet since these imbalances are so unsustainable, something’s gotta give, someday.

Categories
De-dollarization

Rise of the yuan? Not so fast

Berkeley-based economist and titan of the profession Barry Eichengreen notes that the dollar’s reserve currency status is continuing to erode in favor of “non-traditional reserve currencies”. But looking closely at the same recently-released IMF data through Q4 2023 paints a more nuanced picture.

At end-2016, the IMF reclassified yuan holdings from “other” to its own explicit category, so I’ve calculated cumulative changes from Q1 2017 onwards:

  • While the USD’s share in international reserves holdings have dropped by about 7 percentage points since then…
  • …the biggest beneficiary is neither the yuan nor “other” currencies…
  • …but in fact the yen.
  • The yuan has increased its share by about 1 percentage point…
  • …but the euro, pound, and Australian & Canadian dollars have seen their shares increase as well, for a combined total of over 2 percentage points.

So the shift away from the dollar is just as much – if not more – about a rotation into G7+ currencies as it is towards the yuan and other non-traditional reserve currencies. I’ve written previously about how a sizable chunk of Russia’s reserves have been held in Japan and how GBP, AUD, and CAD have been eating up some of the USD’s share.

Categories
De-dollarization

On the hunt for Russia’s reserves

When it comes to appropriating Russia’s central bank reserves for supporting Ukraine, some influential Western constituencies seem to think that the G7 leadership can and should dish out punishment without considering trifling matters such as due process. Such has been the Western enthusiasm for championing the Ukrainian cause, that they might have been right about this – or at least they were until recently. Also, where in the world are the Bank of Russia’s frozen assets?

Back in 2022, some of the many sanctions that several Western countries imposed on Russia in response to its invasion of Ukraine ended up freezing a lot of Russian assets held in various jurisdictions. The Bank of Russia’s immobilized reserves stand somewhere in the $300-350bn range, though it’s not quite clear where exactly it is all held. The quantum rises further, to around $400bn, if one includes the $58bn of Russian billionaire money also currently under sanctions.

That’s a lot of cash, obviously: Ukraine’s nominal GDP is only about $160bn, after having dropped by a third in 2022. With much of Ukraine’s economy and infrastructure in ruins and amid some setbacks on the battlefield, calls for repurposing Russia’s reserves to support and rebuild Ukraine have gained traction in recent months.

Location, location, location

As with so many other examples of opacity plaguing the international financial architecture, it’s unclear where exactly all of the Bank of Russia’s frozen assets actually are. Location matters because it will have at least some bearing as to how any appropriation gets carried out.

The little we know

The chart below is based on a G7 finance ministers’ statement in October 2023 and information posted on Switzerland’s government website in May 2023. The total in the chart comes out to just under $290bn, using current exchange rates, with the Belgian central securities depository Euroclear holding the lion’s share.

Amid reports of $300-$350bn in immobilized Russian central bank reserves, it’s hard to tell where those other $10-60bn in assets might be – or if those numbers are just entirely made up.

Even the “identified” locations in the chart are ambiguous, with the “EU – Other” and “G7 – Other” categories accounting for nearly $80bn.

Detective work

It turns out I’m not the first person to be puzzled by the mysterious whereabouts of Russia’s frozen assets. Nor the second, nor the third.

Inspiring myself from those who came before, I’ve taken a look at BIS data on banks’ liabilities to residents of Russia. Generally speaking, these seem to usually be in the form of deposits owned by entities and persons residing in Russia.

And sure enough, some of those massive Euroclear deposits show up in the chart above, around $136bn. This is less than the $196bn identified by the G7 statement, presented in the pie chart on immobilized reserves, meaning that the difference is presumably because $60bn of the assets aren’t bank liabilities (or simply weren’t reported to the BIS).

The amount of bank liabilities to Russia located in Switzerland are of a similar amount to the ~$8bn in Bank of Russia reserves that the Swiss authorities have reported sanctioning. As with Belgium, this suggests at least partial overlap.

As for the “Other EU” category representing $22.9bn in the first chart, France looks like the primary EU location based on its sizable cross-border bank liabilities to Russia. Press reports appear to confirm this – and that Germany also has Bank of Russia assets.

But it’s still unclear where those $55.5 bn in “Other G7” are held, though there aren’t too many suspects.

Pre-war breakdown

It shouldn’t really come as a surprise that the Bank of Russia has stopped publishing some of its statistics since the war escalated in 2022. But it sure makes it harder – or downright impossible – to know where its international reserves are located.

The last publicly-available data point is from June 30, 2021 and comes from the bank’s last Foreign Exchange and Gold Asset Management Report, released in 2022. Multiplying the $585.3bn total by the published percentages yields the following breakdown in the chart below:

The total held in G7 (i.e. sanctioning) countries – Austria, Canada, France, Germany, Japan, UK, USA – sums to $284.4bn, which is roughly equal to the G7’s October 2023 statement.

Two things:

  • First of all, France held the largest slice of any EU country at the time. Although Germany had a sizable chunk as well, this reconfirms France as the leading candidate for “Other EU.”
  • Secondly, the $58.5bn of Bank of Russia reserves held in Japan in 2021 corresponds neatly to the $55.5bn in “Other G7” in the first chart, which is about as clear an answer as I can hope to glean.

To seize or not to seize?

On the face of it, the arguments for appropriating the reserves make good sense. Ukraine currently requires around $100bn of support annually, $40bn of which is for balance of payments and budgetary purposes and $60bn for the military. Moreover, estimated damage to Ukraine amounts to ~$650bn.

These are steep bills, to say the least, and Kyiv really needs all the money it can get. So, rather than having Western and Ukrainian taxpayers, and Ukraine’s creditors, foot the entire bill, using Russian money amounts to fair burden-sharing, or so the argument goes.

A poisoned chalice

Although there is a strong case for using Russian assets to help Ukraine, the counterargument is also valid. Seizing the assets could set a negative precedent and lead to further global fragmentation, in a world that is already suffering from the effects of deglobalization.

Ambivalence towards Ukraine in much of the non-Western world suggests that appropriating the Bank of Russia’s reserves would be poorly-received and erode trust in Western institutions and the international rules-based order. Worse still, doing so without a solid legal basis could backfire spectacularly in the court of global public opinion.

The irony is that the West would be perceived to be stealing from a regime that it itself views as a kleptocracy. Given their immense wealth, G7 member countries are not condemned to use the weapons of their Russian opponents against them. Despite budgetary pressures, inflation, and other economic challenges, US support for Ukraine pales in comparison to spending on past wars, indicating room for more support.

Outright appropriation could be a major win for the Kremlin, especially if done without a strong legal foundation, without really inflicting further damage on Russia since the reserves are already immobilized. Putin could use it as evidence of Western moral bankruptcy and institutional hypocrisy in outreach to receptive audiences in the Global South. Moscow’s kleptocrats would likely be gleefully rubbing their hands at a new excuse for expropriating any remaining Western businesses in the country.

Furthermore, in the case of seizure, it is unclear if any Western businesses, e.g. Danone, Carlsberg, will have a claim to compensation for their lost assets in Russia, or if all the money would end up going to support Ukraine.

Deep freeze

There are of course other intermediate solutions. The least controversial one is to send the €4.4bn in interest income earned by Euroclear in 2023 – and which belongs to Euroclear – on its sanctioned Russian assets to Ukraine. Another policy proposal is to use the assets as collateral for bonds, whose proceeds would be directed to Ukraine, though France and Germany – as well as the Euroclear CEO – have come out against it.

The most likely outcome seems to be that the assets remain frozen for the foreseeable future while Western policymakers find whether or not there is a path forward. There may not be, for the simple reason that Europe is reticent.

If Donald Trump returns to the White House next January, the prospects of collateralization or seizure would be even more remote. Even now, the Republican party has already abandoned its erstwhile fervor for the Ukrainian cause, holding up a $60bn aid package for Ukraine in Congress.

It’s all so unfortunate because Ukraine desperately needs support, including a Marshall Plan to rebuild. But the truth is that it needed a Marshall Plan 30 years ago, as did Russia and all the other post-Soviet republics.

By failing to help rebuild the post-Soviet space then, the West missed a unique chance to help foster stability in this part of the world and at a much lower cost – especially in blood but also in treasure. As a result, the price to pay is much higher today, whether or not Ukraine ends up getting Russia’s assets.

Categories
De-dollarization

Russia’s trading partners steer clear of rubles

Building on a previous post on the de-dollarization debate, a snapshot of Russian trade invoicing data gives a sense of a potentially maximum speed of the dollar’s declining use in some quarters of the global economy, while also revealing how Moscow’s trading partners are willing to part with rubles but unwilling to receive them.

As has been widely reported, trade with Russia since the start of the war in Ukraine in February 2022 is being invoiced increasingly in Chinese yuan, at the expense of the dollar and euro. Russian imports in CNY have increased over 8x from January 2022 to June 2023, rising from $1.1bn to $9.1bn over that period. Meanwhile, USD and EUR fell from a combined $17bn to $8.5bn, with the USD experiencing a drop of around 60%.

And while these comparisons exclude seasonal adjustments, the trend is clear, and comparing year-on-year growth readings for June 2023 versus June 2022 tells the same story: CNY: +148%, USD: -57%, EUR: -35%.

In percentage terms, USD has declined in Russia’s import invoicing from 39% in January 2022 to a mere 16%, while EUR shrank from 26% to 16% as well. That is a combined 33 percentage-point drop for both currencies.

In the same period, CNY’s share rose 30 ppts, from 4% to 34%, almost entirely replacing USD and EUR. Moderate increases in the shares of other currencies and the RUB explain the remainder, though the fact that the RUB has only risen 1 ppt suggests that exporters to Russia are reluctant to accept Moscow’s currency.

Looking at the export side reveals a similar picture. Only $170mn Russian exports were invoiced in CNY back in January 2022, whereas in June 2023 these exceeded $8.1bn. While the USD and EUR each accounted for $25bn and $17bn at the time, these have fallen off to around $7bn and $2bn currently, respectively.

In contrast to Russian imports, where the USD’s decline was more precipitous, it is EUR that had the faster drop in the case of exports, likely due in significant part to the sharp reduction in Russian energy exports to Europe. Another difference is that, unlike Russia’s imports, which have remained somewhat stable over this period, the country’s exports appear to be on a declining trend, pointing to downward pressures on the trade balance.

Staggeringly, CNY now accounts for a quarter of payments that Russia receives for its exports, up from less than half a percent 18 months prior. The USD share is down from over half of all export receipts to some 23%, while the EUR has decreased from 35% to 7%.

Surprisingly, RUB has increased markedly, from 12% to 42%, though this makes good sense if one considers that foreign buyers are likely keen to reduce any long exposures they may have to the ruble. Such positioning currently appears to prescient, given the RUB’s significant weakening to ~100/USD at the time of writing.

Future posts will explore the implications for the dollar’s role and the bigger question of using frozen Russian assets for the reconstruction of Ukraine.

Categories
De-dollarization

De-dollarization musings

De-dollarization has become an increasingly popular topic in recent years, and for good reason. Indeed, the global economy has been gradually entering a period of deglobalization for the past decade or so, and, in parallel, the U.S.-led nature of the international economic order is facing challenges from geopolitical competitors and a disenchanted Global South.

Yet much of the ideologically-driven discourse on the greenback’s supposedly-imminent demise fails to account for the USD’s security and demographic underpinnings and the absence of viable alternatives. The U.S. dollar’s role is both a reflection of and a driving force behind the moral values governing the global financial architecture, with significant implications for global economic growth, international security, and the fate of Ukraine.

This article will be the first of many to explore de-dollarization and related phenomena, including sanctions, trade, and geopolitics. As a starting point, tracking the use of the U.S. dollar in international sovereign reserves and in international trade provides a solid foundation for further analysis.

Official Foreign Exchange Reserves

The chart above illustrates the prominence of the USD in governments’ international reserves, accounting for over $6.5 trillion as of Q1 2023 – nearly 60% of the global total.1The “unallocated” reserves in grey are merely the USD value of official FX reserve assets for which the IMF has no currency decomposition. The IMF collects this currency composition of reserves data from its member countries, many of which report it on an anonymized basis for public disclosure.

Unfortunately, a currency breakdown of reserves by country appears to be unavailable to the public via the IMF, which is partly understandable given geopolitical sensitivities that some countries may have in revealing this information. Still, this opacity is yet another of a plethora of examples of sovereign financial data transparency practices found wanting, even if currency composition may be available from some national sources.

While the first chart at the top of the piece shows absolute totals and is useful in seeing changes in global reserve quantities – such as the quarterly declines in 2022 – a proportional view is more helpful from a de-dollarization perspective. The interactive chart below shows that from a peak in this sample of over 72% in the early 2000s, for the proportion of reserves disclosed2The IMF designates these as “allocated” official FX reserves. by currency to the IMF, the USD slumped to a trough of just under 59% in Q4 2021, a 13-percentage points decline.

So which currencies did the USD lose ground to? China is indeed part of the story, with CNY having risen from nil to…a peak of merely 2.8%. That leaves 10 of the 13 ppts to account for. The euro also contributes to the USD decline but only modestly because, despite its share having risen in the middle years of the sample, in 2023 it only stands at ~1-2 ppts above where it started 24 years ago. The yen is certainly not the culprit, as it has actually lost some ground as well, albeit only 0.5-1 ppt depending on chosen measurement times.

It is in fact other currencies that explain most of the USD’s loss of share in official reserves, especially sterling and the Australian and Canadian dollars. GBP accounts for a nearly 2 ppts rise from 1999 to 2023. AUD and CAD are slightly harder to measure over the full sample period because the IMF clearly recategorized them both in 2012, moving them from the “Other” currency category into their own standalone categories, presumably because of their growing shares. In 1999, the “Other” category stood at some 1.6%, while summing “Other” with CAD and AUD in 2023 yields a figure of 7.7%, pointing to a 6 ppts difference, of which only 1.7 ppts came from currencies other than CAD and AUD. To simplify, CAD and AUD combined for a 4.3 ppts bite into the USD share.

The reality of other advanced economy currencies displacing the USD as a reserve currency stands in marked contrast to prevailing ideological narratives that the USD decline is related mostly or solely to the rise of emerging market currencies such as CNY. While there is ample evidence for central banks repatriating gold in the wake of U.S. sanctions against Russia and freezing of its reserve USD assets following Moscow’s invasion of Ukraine in February 2022,3https://www.reuters.com/business/finance/countries-repatriating-gold-wake-sanctions-against-russia-study-2023-07-10/ there has been no associated decline of the USD’s reserves standing. In fact, since the war began last year, the USD slice has risen from just under 59% to over 60% this year, while the yuan’s has fallen by 0.2 ppts.

Trade Invoicing

In 2020, then-IMF Chief Economist Gita Gopinath and colleagues published an IMF working paper4https://www.imf.org/en/Publications/WP/Issues/2020/07/17/Patterns-in-Invoicing-Currency-in-Global-Trade-49574 on the invoicing of international trade by currency, building on Gopinath’s prior extensive academic work in this area.

Here too there is broad-based evidence of a declining role of the USD. The greenback’s decline is most evident when comparing the early 2000s to the present day, though Gopinath, Boz, et al.’s dataset has less country coverage that far back. For this reason, the most recent year of available data – 2019 – is compared to 2010, to provide a snapshot of currency invoicing of exports and imports trends over the decade.

The two charts below show overall lower use of the USD in export and import invoicing in 2019 versus 2010 in most countries, although there are outliers on either side of the diagonal change demarcation line, e.g. Russia and Cyprus. As with official reserves, it appears that another advanced economy currency – the euro in this case – could be responsible for taking away USD market share, as many of the country declines are either in the Euro area or in Europe.

The situation is different for EUR, which saw its trade invoicing presence grow in most of the sample countries in the 2010s. This confirms the suspicions above that EUR was displacing the USD in the euro area and Europe but goes further by demonstrating EUR’s growing role outside Europe as well, e.g. Israel, Chile, Indonesia, Thailand.

These last two charts present the change in invoicing in currencies that are neither the USD nor the EUR and appears to include a country’s home currency, at least for imports.5The metadata in the dataset leaves room for ambiguity on this nuance. Here the picture is mixed, with a relatively even balance between increases and decreases across countries over the period. Yet some of the outliers provide compelling avenues for further research. For instance, Tunisia’s apparent switch from invoicing imports in its home currency in 2010 – prior to the Arab Spring, which had its tragically self-immolating spark in Tunis in 2011 – to USD by 2019 raises questions in need of answers, as do the cases of Russia, Ukraine, Cyprus, and Mongolia.

  • 1
    The “unallocated” reserves in grey are merely the USD value of official FX reserve assets for which the IMF has no currency decomposition.
  • 2
    The IMF designates these as “allocated” official FX reserves.
  • 3
    https://www.reuters.com/business/finance/countries-repatriating-gold-wake-sanctions-against-russia-study-2023-07-10/
  • 4
    https://www.imf.org/en/Publications/WP/Issues/2020/07/17/Patterns-in-Invoicing-Currency-in-Global-Trade-49574
  • 5
    The metadata in the dataset leaves room for ambiguity on this nuance.