Categories
Emerging Markets

Egypt: short-term pain, long-term gain

Famous last words, but this time could be different.

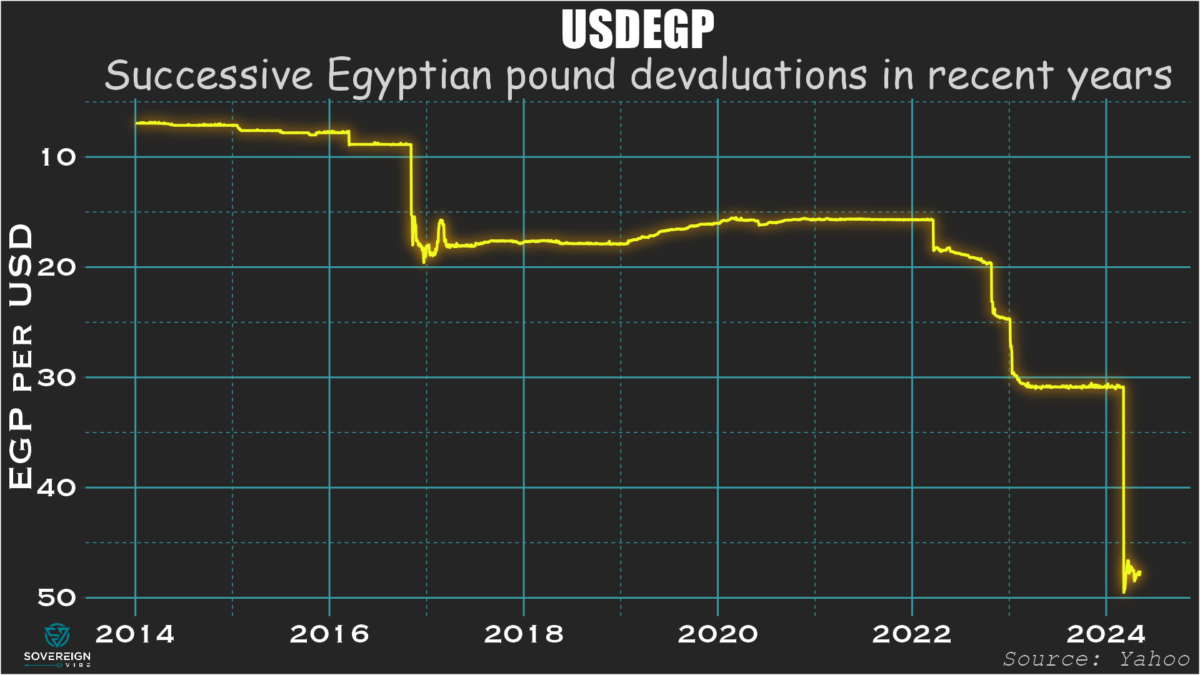
Big things are happening with Egypt’s economic policy management, and investors are taking notice. Though as with any other emerging market, the question that shouldn’t be asked is so often the same: is this time different? One of the most obvious symptoms of change is the major devaluation of the Egyptian pound, which slid from around 30 to the dollar to nearly 50 in early March.

Good news

Two major announcements for Egypt this year have been game changers in terms of easing FX payments pressures on the country. The first is a $5 billion increase in the IMF’s Extended Fund Facility to $8 billion, a clear vote of confidence by IMF staff over economic policymaking. The second is a blockbuster deal with Abu Dhabi-based ADQ to invest $35 billion in Ras El Hekma on Egypt’s Mediterranean coast, equivalent to about 7% of the GDP and planned for rapid disbursement.

This is all terrific news but will only matter in the long term if the government gets its economic policies right and restores macroeconomic balance sustainably. Clearly, the authorities are making strides towards a more flexible exchange rate regime. However, this is the sixth devaluation since the start of 2016, so observers should also temper their expectations regarding the authorities’ commitment.

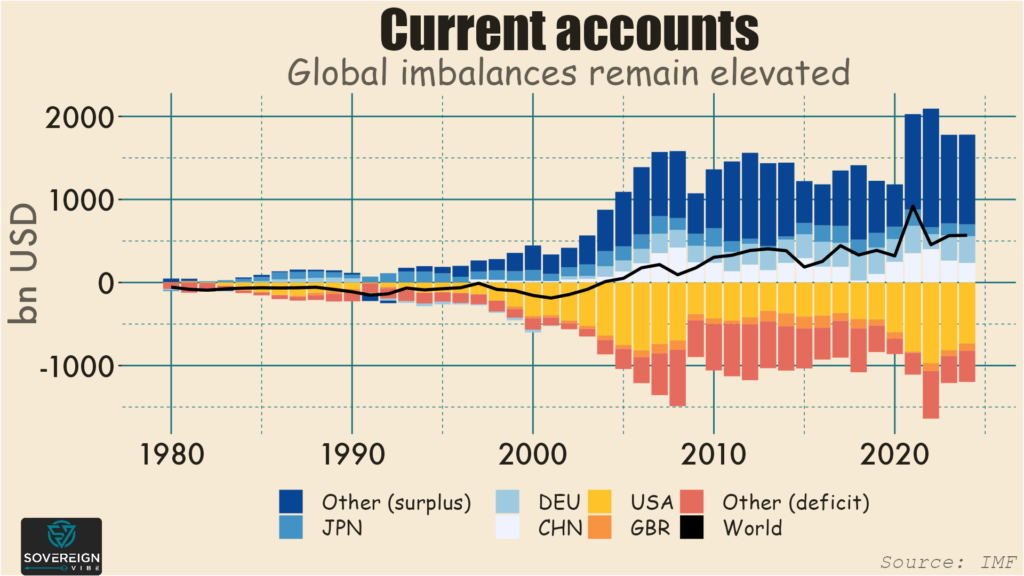
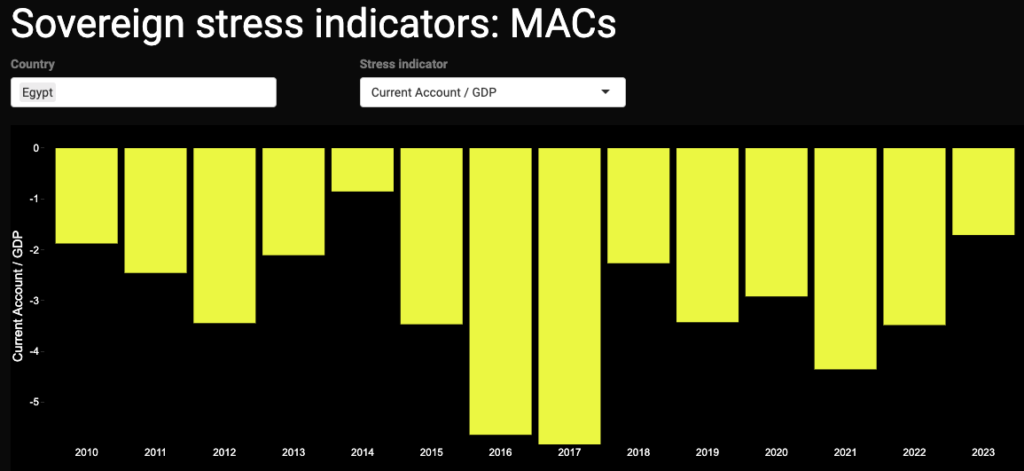
Yet the devaluations in 2022 are already having a positive impact. Using Sovereign Vibe’s dashboard of sovereign stress indicators, the current account balance (CAB) deficit has been narrowing:

Diving in to more detail on how the 2022 devaluations have been helping Egypt bring its CAB back towards positive territory, taking a look at the underlying CAB is helpful. A crucial component of Sovereign Vibe’s broader fair value currency model, the underlying CAB is the CAB adjusted for the lagged effects of:

  • real exchange rates changes,
  • the domestic output gap, and
  • the trade-weighted foreign output gap.

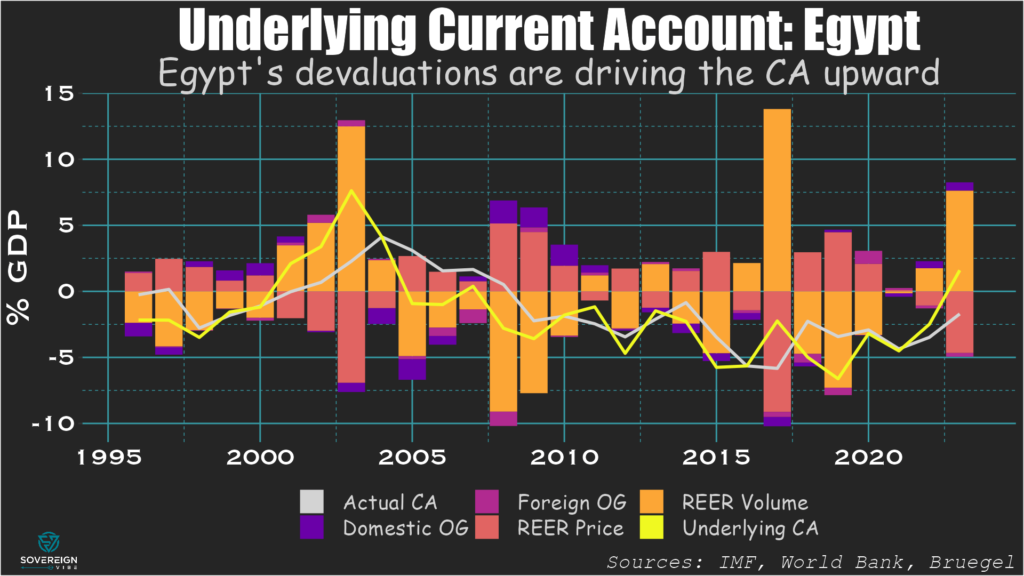
Egypt’s 2022 real devaluations had a small impact in 2022 and a large one in 2023 on trade volumes and trade prices. These always respond in the opposite way to REER changes. As seen here, a decrease in the REER (i.e. a devaluation) causes a positive volume effect on the CAB (chiefly via higher net exports) and a negative price effect on the CAB (via higher import prices). Crucially, the relevant literature finds that the volume effect outweighs the price effect. This is all good news for Egypt.

Short-term pain, long-term gain

Here is some REER data through February 2024, right before Egypt’s massive devaluation this year. As you can see, the inflation differential with its trading partners was already skyrocketing:

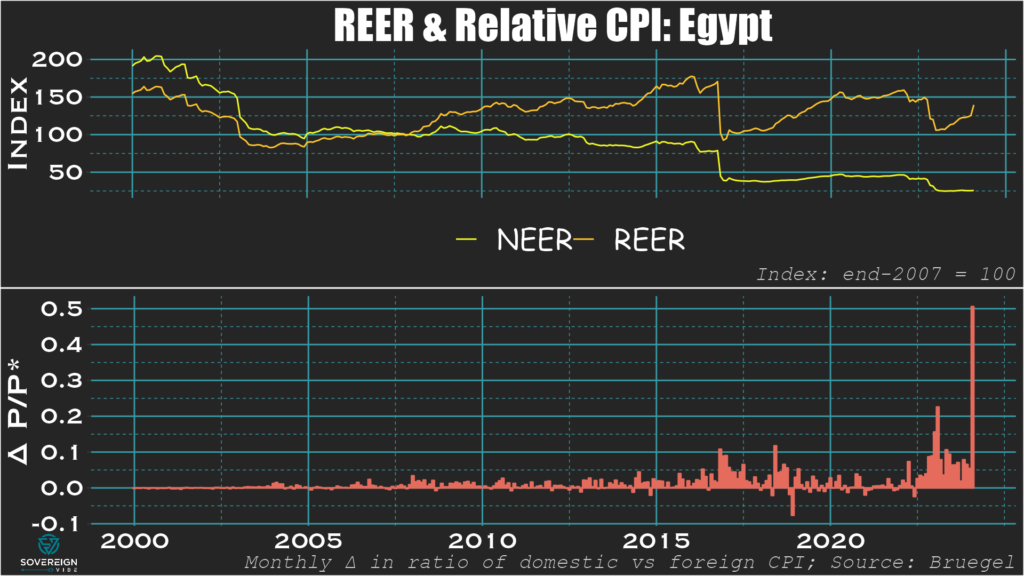
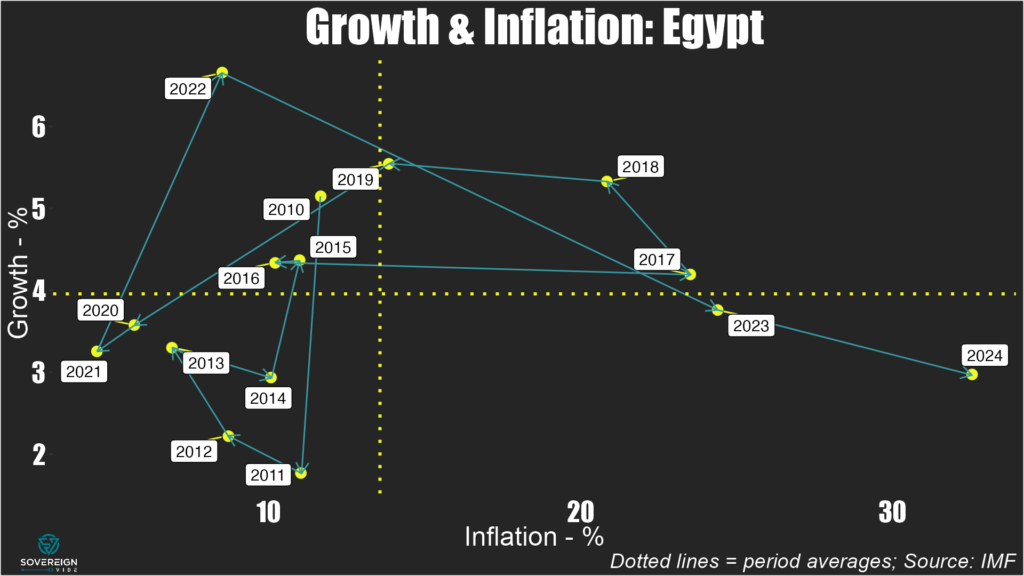
Inflation is indeed running rampant, with the IMF projecting it to exceed 30% over the course of 2024. This is of course extremely harmful to ordinary citizens who are seeing their purchasing power eroded. In response, the Central Bank of Egypt has taken the sensible step of increasing its policy rate significantly, by at least +800 basis points in Q1 alone. Unfortunately, growth has also been slowing since a post-pandemic rebound in 2022.

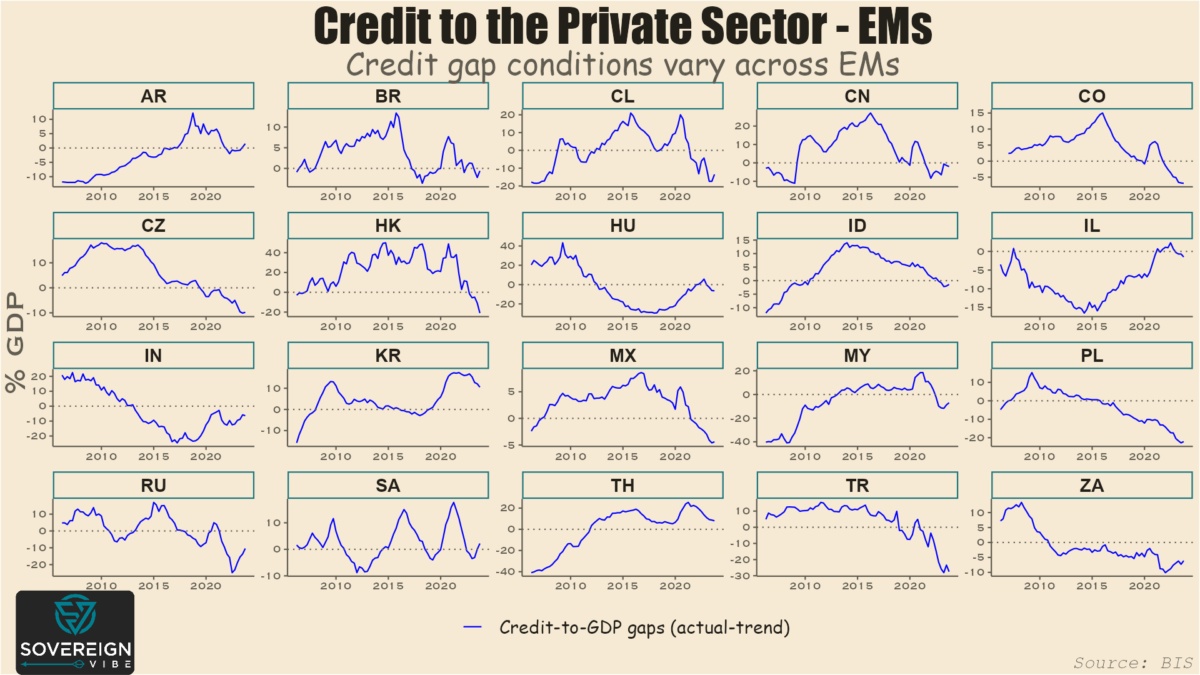
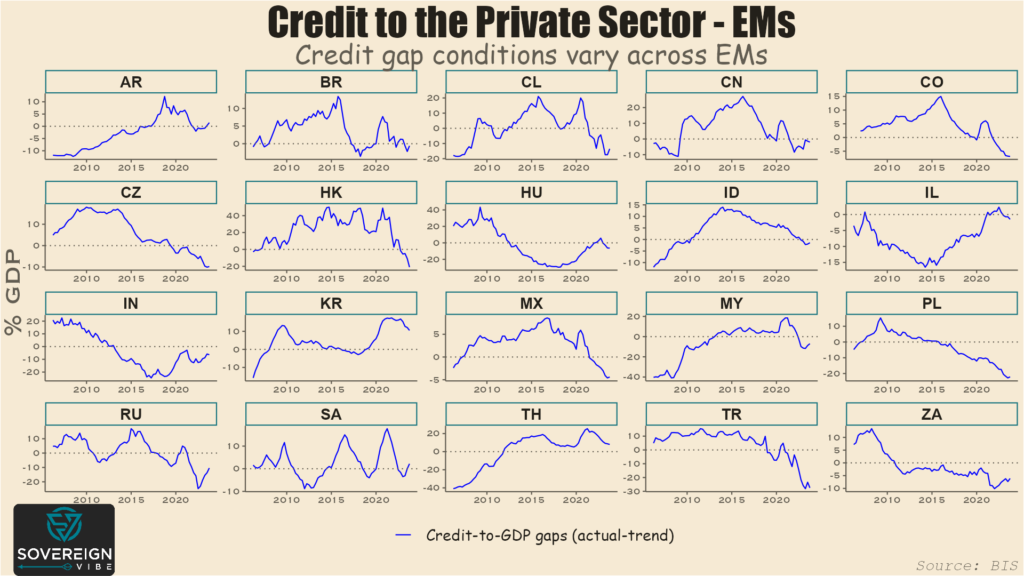
Public sector profligacy, private sector exclusion

At only 30% of GDP, Egypt’s credit to the non-financial private sector (i.e. households and non-financial corporates) is significantly lower than in most other EMs. As such, it’s necessary to direct more credit towards the private sector, and this corresponds to the structural reforms the government is undertaking with IMF support. One change under way relates to eliminating preferential tax incentives for state-owned enterprises.

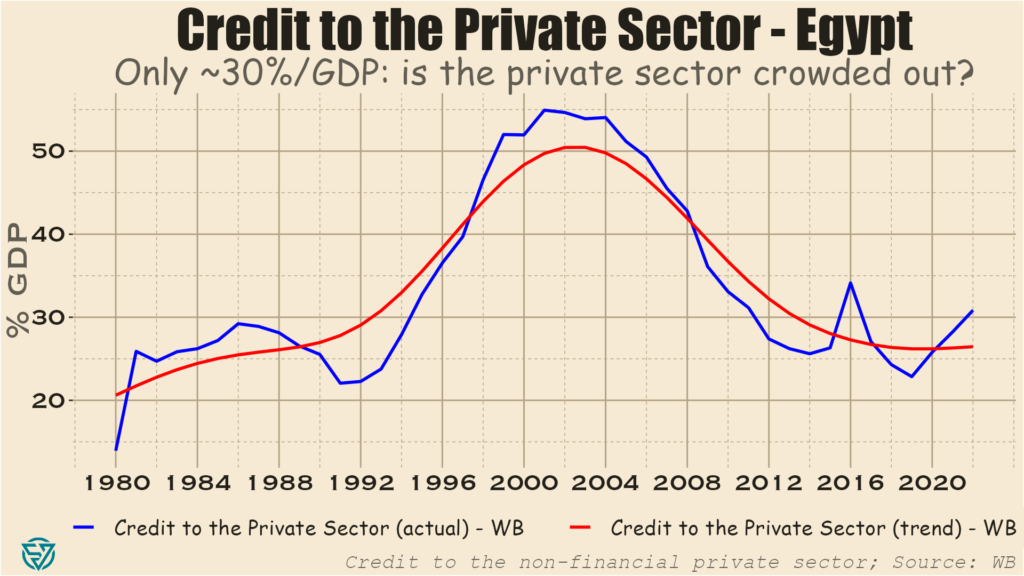
Egypt is a clear-cut case of public sector borrowing crowding out credit to the private sector. In other words, the government borrows so much that there isn’t much credit left over for firms and households. SOE tax breaks are only one symptom of this. The bigger picture is that the government has been running budget deficits in excess of 5% of GDP since 2008. All that net borrowing has caught up to the government, as net interest payments have grown markedly.

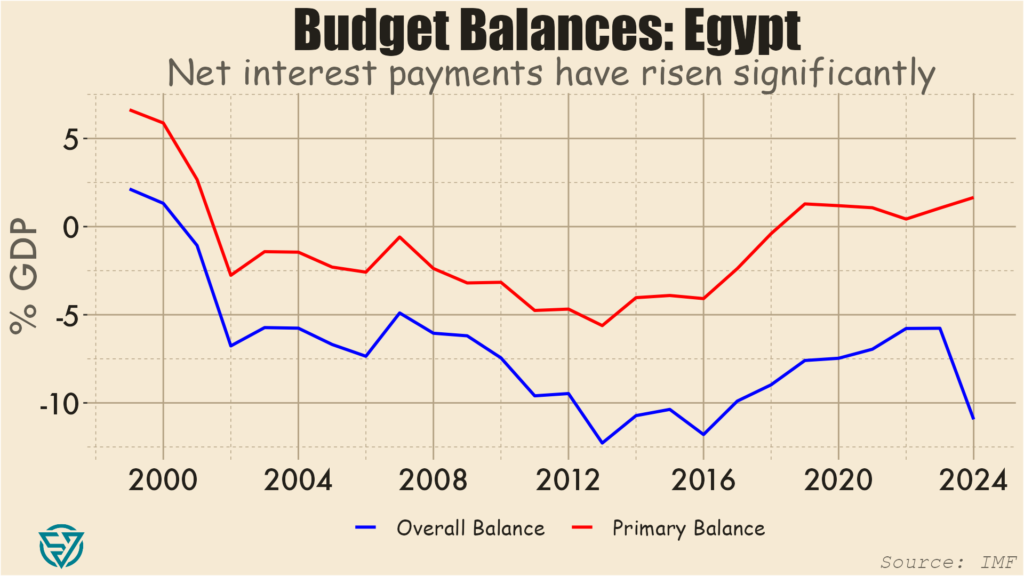
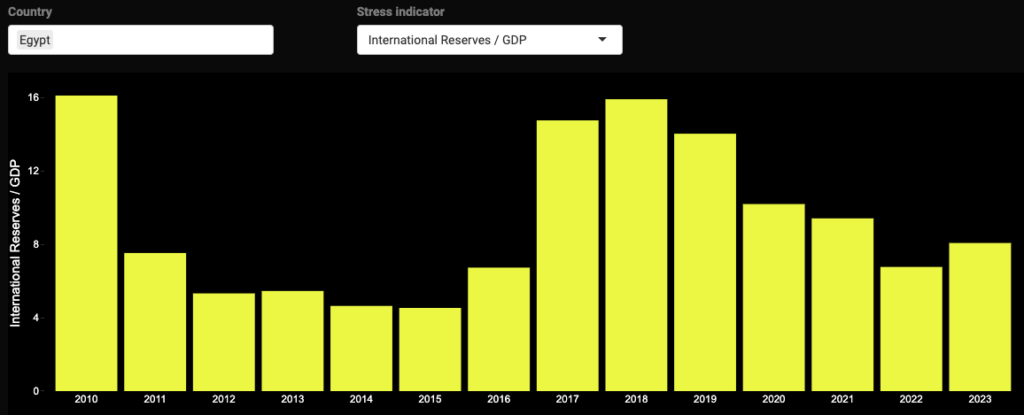
The primary budget balance, which excludes net interest payments on debt, has actually been positive since 2019. In 2024, the gap between the overall and primary budget balances is projected to be ~15% of GDP. This gap is equal to net interest, suggesting net payments of around $70 billion this year. For comparison, Egypt’s official international reserves stood at only ~8% of GDP in 2023, though these are no doubt increasing substantially in 2024 amid the IMF and ADQ disbursements.

Silver lining

So the policy prescription is quite clear: re-direct resources and credit from the wasteful public sector to the private sector and unleash its productive potential. Increasing lending to the private sector, or any sector, is challenging amid monetary policy tightening, which Egypt is currently going through in its battle against inflation, but must be the medium- and long-term plan.

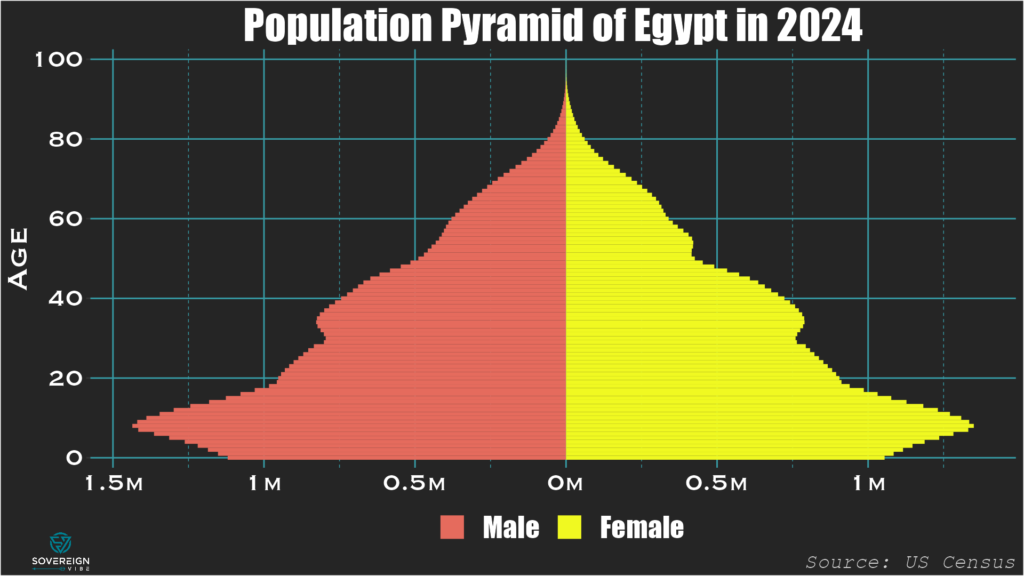
If the authorities can get it right, the Egyptian economy’s best days should be ahead of it, as the demographic trends are evolving favorably. The government has succeeded in bringing the birth rate down from 3.5 to 2.85 per woman in the past five years, which is converging towards the replacement rate of 2.1. In this country of 105 million, youth unemployment will likely remain a challenge in the short- and medium-terms, but these pressures should abate over the long-term ceteris paribus.

The 2024 devaluation, for all the short term pain via exchange rate inflation pass-through, should help unlock export-oriented opportunities for the economy and thus stoke growth, decrease unemployment, and put the government on an improved budgetary footing.

Categories
Macro

EM is ahead of DM in the global credit cycle

Today’s charts are snapshots of credit-to-GDP gaps in emerging and advanced economies. As a reminder, the credit gap measures the difference between actual credit to the private sector and trend credit to the private sector.

These estimates through Q3 2023 are provided by the Bank for International Settlements, which describes its credit-to-GDP ratio as capturing total borrowing from all domestic and foreign sources by the private non-financial sector.

Several factors have an impact in determining private sector borrowing. These include how developed the country’s financial system is, the ability of domestic firms to borrow internationally, and the extent to which public sector borrowing crowds out the private sector.

As such, the level of credit to the private sector as a percentage of GDP varies significantly from country to country. It is therefore more helpful to look at credit-to-GDP gaps when comparing across countries.

Besides, credit gaps are one measure that the IMF uses in measuring sovereign stress for market-access countries. A high, positive credit gap can point to the presence a credit bubble. Such bubbles are sometimes a symptom of macroeconomic imbalances and policies that can lead to sovereign debt strains.

There is little evidence of excessive credit gaps in emerging markets. The absence of credit bubbles is at least partly attributable to EM central banks hiking rates rapidly in response to inflation when it first began appearing in the latter stages of the pandemic. This early tightening has enable EM central banks to start easing before many of their developed market peers, e.g. Brazil and Mexico in Q1-2024.

Of course the chief objective of monetary policy is price stability. But, by definition, rate changes also affect credit conditions and lending.

South Korea is one of only two EMs in this sample with a sizable, positive credit gap. That excess credit is, however, declining, as the country’s central bank maintains its policy rate at a 15-year high with no signs of imminent loosening.

The other is Thailand, where the central bank is holding its policy rate steady despite political pressure to ease. In the meantime, its credit gap is also narrowing.

This relatively benign outlook across major EM is a sign of improving policy credibility compared to the volatility that led to various EM financial crises in the past. On the other hand, a negative credit gap doesn’t necessarily indicate sound macroeconomic management, e.g. see Turkey, South Africa etc.

The BIS only provides data for 21 EMs, which is already a lot. But achieving broader country coverage is why I also use similar World Bank data in my sovereign stress analysis.

Looking at advanced economies, the gaps are virtually all negative, as in EM. But, unlike EM, almost all of the gaps appear to still be widening, representing the later start to post-pandemic monetary policy tightening by AE central banks.

Note the sizable negative gap in the Euro Area (i.e. “XM”), which is a cyclical indicator suggesting that a turning point for the ECB might not be too far off. Indeed, Switzerland has recently led the way with a first DM rate cut this cycle. Japan is the outlier with its large, positive credit surplus, but tighter monetary policy has been eroding that gap in recent quarters.

Categories
Macro

Supply constraints are driving US inflation

Higher for (a bit) longer, but don’t buy into inflationista hype.

I wrote recently that emerging market sovereigns considering new issuance should be ready for Federal Reserve rate cuts in 2024, despite the hot Q1 inflation prints. The point is that core goods inflation has all but disappeared from the consumer price index and that core services inflation is concentrated in the transportation services segment, particularly motor vehicle insurance. The rise in car insurance costs in the US is a structural change, and the base effect will be locked in before long.

This inflation stickiness in transportation services is a lingering effect of Covid supply chain disruptions. Although these have lasted longer than most expected, they won’t last forever and will be resolved eventually. Juxtapose that point with data out of the San Francisco Fed that measures volume dynamics to gauge whether price rises are supply- or demand-driven. Supply is currently driving inflation, which confirms the CPI narrative around motor vehicle services.

This week of course Jerome Powell signaled that rates would be staying higher for longer. This makes good sense given higher Q1 inflation following his (overly) dovish remarks in December that markets interpreted (too) exuberantly.

One-to-two rate cuts are still priced in for this year, and any talk of new rate hikes are overblown. Powell himself said this week that a rate increase would be “unlikely.” Moreover, the Fed is slowing down its quantitative tightening program, lowering the monthly cap on US Treasuries it rolls off its balance sheet from $60bn to $25bn. So rates may be higher for longer than expected amid all the December-January euphoria, but the wind is still blowing in an “easing” rather than in a “tightening” direction.

There are other reasons that declining inflation and lower rates are likely in store later this year. Monetary policy has a lag time, so the restrictive stance that has been in place for the past few years will continue to work through the economy. There is also a post-Covid negative potential GDP trajectory gap, a point that my former colleague Robin Brooks makes. In fact, I’m hardly alone on this: see Claudia Sahm on the Covid hangover and Brian Levitt of Invesco on transportation services.

I’ll get back to more of a direct focus on emerging markets next week, but it’s important for EM watchers to keep an eye on the elephant in the room as well. Those developed market policy rates tend to have statistically significant negative relationships with capital flows to and from EM. Besides, Sovereign Vibe is also about global macro!

Categories
Macro

What does US inflation mean for EM sovereigns?

Debt management offices in emerging market finance ministries should be prepared for Fed rate cuts.

Emerging market sovereign debt issuance started 2024 off strongly with record-breaking issuance in January at ~$47bn and another ~$16bn in February, marking the highest January-February result since before the pandemic. Sub-Saharan African sovereigns even returned to the Eurobond market, with Côte d’Ivoire leading the way and Benin placing a debut issuance. Larger players including Saudi Arabia, Mexico, Indonesia, Hungary, and Romania made placements as well.

With borrowing costs having immediately fallen in the wake of Federal Reserve Chair Jerome Powell’s dovish comments on US inflation in December, the start-of-the-year timing for issuance was savvy given renewed concerns since March around higher-for-longer interest rates. With the 10-year US Treasury yield having climbed nearly 600bps since early March and the dollar also strengthening, debt management offices have likely become more circumspect regarding US inflation and the Fed.

The fading prospects of US rate cuts before H2 haven’t put a halt to activity this April out of Abu Dhabi and, more absurdly, El Salvador. And other debt management offices, including Tanzania, are also considering Eurobond issuance. Apparently EM sovereigns have issued about $93bn so far this year, which means about $30bn for March-April. These are still big numbers, but nothing close to that fast start in January.

Friday’s US inflation print came in hotter than expected, fueling ongoing concerns that rates will have to stay high for a while yet. The Fed’s preferred metric is core personal consumption expenditures (i.e. ex-food and energy), which rose 2.8% year-over-year in March – a third high monthly reading in a row. But digging through US data shows that the Fed may yet bring inflation lower soon. Looking at the consumer price index provides more granularity than is easily available through PCE, though it measures slightly different things.

In any case, it’s clear that almost all price pressures are emanating from services, with core (i.e. ex-food and energy) goods inflation having even turned negative. Within services, the largest component is shelter, which is often the case historically as well, but shelter inflation has moderated significantly over the past several months.

The main inflationary challenge is actually in the transportation services segment, which accounts for the lion’s share of services ex-shelter inflation. Within this category, motor vehicle insurance prices have been surging, e.g. 22% y-o-y in March, due to lingering Covid-era supply chain effects, changing car technology, higher car prices, and higher repair costs. It is likely that these factors are now locked in and will not rise much further, if at all. With the high base effect is now baked in, transportation services inflation will almost certainly fade over the coming months.

The upshot is that emerging market DMOs should expect US inflation to moderate over the coming months and for the Fed to cut rates at some point this year – and perhaps sooner rather than later. So I wouldn’t be surprised to see a pick-up in EM issuance again this year, though investor demand may be more for EM IG than for EM HY. Whether it’s wiser to place a Eurobond or a local currency bond, and whether offices should hedge their currency exposure in the former case is another matter. In the meantime, let the roadshows begin?

Categories
Geopolitics

Are geopolitical risks priced in?

Oil prices have actually declined in the wake of Iran-Israel.

In remarks made on Tuesday this week, JPMorgan Chase boss Jamie Dimon stated, among other things, that he’s surprised at oil not rising further amid recent geopolitical tensions.

Brent crude has mostly been trading in the $85-90 range over the past month, though that is still up significantly from around $75 at the beginning of the year.

The man certainly has a point here, especially if energy infrastructure suffers damage in the Middle East and Europe. Yet the Iran-Israel strikes over the past ten days haven’t had a discernible impact.

In fact, oil prices have declined from around $90 to $88 in recent days on the back of slower US business activity and easing concerns over the Middle East. The American cool-off makes good sense, at least.

But with war raging in Ukraine, disruptions to Red Sea maritime traffic, the ongoing Gaza situation, and a series of other conflicts around the world, perhaps markets are becoming desensitized to bad news. At least for now.

In any case, the geopolitical backdrop strikes me as exceedingly gloomy, and perhaps investors are getting complacent about geopolitics, just as they were about inflation around the turn of the year.

Speaking of which, with sticky US inflation and the possibility of another rate rise now on the cards, the double-whammy of an even stronger USD and even higher oil prices would be especially challenging for oil-importing emerging markets. This is not an outcome anyone should want, since the EM/FM universe is awash in dollar-denominated debt.

I’m not the only one in a risk-off mood, with gold currently at record highs. Though skittish sentiment isn’t full-fledged. One of the other main safe haven assets, the yen, is persistently weak, with PMI still below break-even despite some signs of recovery.

I wouldn’t be surprised to see the yen and oil rise in coming weeks given all the smoldering fuses currently inhabiting a geopolitical landscape of powder-kegs.

Categories
De-dollarization

The dollar-debt imbalance

One of the major announcements at last week’s World Bank/IMF Spring Meetings concerns the unsustainable rise in US government debt. While it’s old news that the budget deficit is large – $1.7tn / 6.3% of GDP in 2023 and a projected $1.6tn in 2024, I want to highlight how US debt relates to the the role of the dollar internationally. Besides, the Springs also mean there is new IMF WEO data to play with:

De-dollarization has become a hot topic in recent years, with many observers siding ideologically “against” the USD, e.g. Brazil’s president Lula asking why international transactions should occur in dollars. Many also claim that the yuan and other BRICS currencies are rising in importance. While it’s true that RMB is playing a greater role in trade invoicing and international reserves, this increase is limited to either specific countries (e.g. Russia) or has been less than the rising prominence of other G7 currencies.

Yet such grandstanding belies ignorance of why the greenback is so dominant. China scholar and Carnegie Endowment fellow Michael Pettis explains this with his usual brilliance.

Essentially, countries that run current account surpluses – (remember that the current account is the trade balance plus other sources of foreign income) – are subsidizing manufacturing. China and Germany are prime examples.

In contrast, deficit countries are subsidizing consumption. The US and – to a much lesser extent – the UK have the largest average current account shortfalls in dollar terms.

One way to think about current accounts is that they are equal to savings minus investment, on a national level. Savings is of course the difference between income and consumption. So, when a country has a positive current account balance, it is saving more than it is investing. The reverse is true for CAB deficits:

Current Account Balance = Savings - Investment

It follows that for a current account to rise, savings increases and/or investment decreases. For a current account to decline, savings decreases and/or investment increases.

Capital account

Another important piece of the puzzle is the capital account, which is open in the US and other G7 countries, but not in China. Investors understandably prefer to send their capital to countries with strong property rights, institutions, and rule of law. These robust investor protections is one of the reasons why the US and the UK and, to a lesser extent, Canada and Australia have such large deficits.

In other words, in countries with open capital accounts, when net international capital inflows are positive, the balance of payments means that the current account has to be negative (barring some potential temporary effects via international reserves dynamics).

Transfers, both internal & external

Surplus countries such as China, Germany, and Japan subsidize manufacturing at the expense of domestic consumers. Low interest rates and low wages, in China and Germany’s cases at least, result in net transfers from savers (i.e. households and workers) to manufacturing firms. Along with their manufactured goods, they are also “exporting” weak domestic consumer demand to other countries.

To resolve this external imbalance, deficit countries like the US and UK have to either decrease savings and/or increase investment. But, with companies either holding large cash balances or using them to buy back stock, there seem to be few signs of increasing investment. This means that savings must be negative. This can occur via increased unemployment, but, to avoid this, the government instead subsidizes consumption (at the expense of manufacturing) via increased household and/or government debt.

As such, exploding US government debt is partly a result of these external trade imbalances. This begs the question why the US accepts an undervalued yuan and large negative trade deficit with China, though the White House has certainly pushed back against this arrangement at various points.

Narrow interests

As is often the case, the status quo is a result that serves a specific set of narrow interests. With the US running such a large current account deficit, other countries acquire US financial assets denominated in dollars, meaning that the US exports its financial assets to the rest of the world. Doing so ensures the dollar’s status not only as a store of value but also as a medium of exchange internationally, which is what gives the US government power to levy financial sanctions and US banks power to dominate transactions.

Yet this situation is neither sustainable for the US government and households, nor is it desirable for most Americans. Even disregarding the overuse of sanctions, the effects of USD prevalence are negative abroad as well. For instance, greenback dominance has generally resulted in a strong dollar, which is not beneficial for global trade.

Unsustainable status quo: here to stay?

In fact, the global trading system works terribly. Ideally, wealthy countries would run surpluses, and EMDEs would run deficits in order to funnel rich-world savings towards domestic investment. But EMDEs present a variety of risks to investors, who prefer to have higher allocations to safer countries, e.g. the Anglosphere.

It is not the yuan or some other currency that will dislodge the dollar. Rather, it would be some combination of push and pull factors outside and inside the US. China and other surplus countries could stop incentivizing manufacturing and instead increase consumption and, in some cases, investment. US policymakers could reduce fiscal and household debt accumulation while encouraging exports of goods and services.

In both the surplus and deficit cases, restoring that balance between consumption and manufacturing would have broad-based economic benefits. Unfortunately, the prospects for either of these outcomes seem remote because of the political priorities of Beijing’s surplus maximization and of Washington’s dollar weaponization, both of which are cornerstones of this deglobalizing era. Yet since these imbalances are so unsustainable, something’s gotta give, someday.

Categories
Geopolitics

Wall Street’s fear gauge rises

The headline article in yesterday’s FT focused on the “soaring” Vix index, a well-known measure of investor skittishness.

Much ado about VIX

VIX rises when market participants expect more volatility in the S&P 500, as it reflects the cost of buying options used to profit from changes in stock prices.

It’s clear that markets are concerned that interest rates will be higher for longer in the US as the Fed grapples with sticky inflation and by escalating Iran-Israel tensions.

These are the reasons that pushed VIX this week to its highest level since October (see chart). That spike occurred amid investor worries over Hamas’s attack on Israel and before Fed chair Jerome Powell’s dovish end-of-year remarks.

VIX is actually quite low

While it is true that this could mark a turning point for markets, what stands out to me is how low VIX went in December and January. Upbeat sentiment around the Fed lowering rates by June or earlier would certainly have warranted somewhat of a decline.

But Israel’s retaliation against Gaza, Houthi attacks on maritime traffic in the Red Sea, and reversals on the battlefield for Ukraine’s military amid US Congressional delays on aid have punctuated the past several months. These should have dampened investor euphoria more than they did.

Moreover, taking the long view, VIX isn’t exactly “soaring” (see chart). Perhaps it should be higher than where it currently is, and may well rise.

But, frankly, with the pandemic and the wars in Ukraine and Gaza defining the decade so far, this modest rise in the VIX shouldn’t be at all surprising. This is what I believe is called, in the official parlance, a nothingburger.

As for the supposedly “soaring” VIX, for the FT I have only one question:

Categories
Emerging Markets

The Modi mojo is working

India’s economy is in great shape as it heads to the polls… but something’s off.

With India’s general elections getting under way on Friday, much of the focus this week will be on the world’s most populous country and largest democracy. So here are some charts to help you look beyond the headlines and arm yourselves with some facts.

Modi’s mojo

South Asia is the fastest-growing of all emerging market and developing economy regions, largely thanks to robust growth in India on the back of strong public investment and dynamic services.

Growth rebounded strongly thanks to a post-2020 base effect, breaching 9% in 2021 before moderating to ~7+% in 2022 and ~6+% in 2023 and 2024. These are excellent numbers, particularly given that inflation is gradually declining towards the Reserve Bank of India’s 4% target. All of this situates growth and inflation above and below their averages since 2010, respectively (see chart below). So it is little wonder that Narendra Modi’s BJP is so strongly positioned as India heads to the polls.

A global perspective

Zooming out, India’s population is still heavily under-represented in the global economy. Its 1.4bn+ souls account for nearly 18% of the world’s total, while its share of global GDP is only a bit above 3%.

Yet the country is certainly punching above its weight when it comes to contributions to global GDP growth, as it is contributing 6% of global growth (see chart below) from its 3% slice. This ratio is likely to evolve favorably for India in coming years as China’s growth continues to slow.

Demographics

The pyramid below has an ideal shape for economic growth in India over the next decades. A huge cohort of young people – the world’s largest – is moving into the workforce, even as birth rates moderated over the past couple of decades. This will decrease the dependency ratios of the young and old on people of working age and likely contribute strongly to growth, savings, and development in the years ahead.

However, it is concerning to see such a large imbalance between the number of men and women in India, with men far outnumbering women. The gap is as wide as 2 million for each age for people in their 20s and 30s. It is estimated that there are around 106.5 men for every 100 women in the country. This is the type of ratio that could potentially lead to instability and violence under certain conditions, though hopefully India’s robust output growth can continue to be somewhat of a palliative to that.

Categories
Macro

Central banks to weigh on 2024 markets

As global markets grapple with the prospect of higher rates for longer, it’s important to keep an eye on another important potential headwind: the direction of worldwide central bank asset purchases.

Without delving too deeply into the history of unconventional monetary policy, post-Global Financial Crisis the world’s major central banks implemented quantitative easing programs. This meant buying government bonds as a way to further support recovery by injecting cash into the economy. As a result, central bank balance sheets expanded significantly.

All the extra liquidity swilling around as a result of these purchases clearly has an impact on markets. When central bank buying decreases, this often seems to coincide with challenging periods for the S&P500, the MSCI All-World Index, and others. For example, 2018 and 2022 saw poor market returns, just as central bank asset purchasing was dipping in to negative territory, as presented in the chart below.

Looking at the balance sheets of major central banks, purchases of total assets are simply any changes from one period to the next. I’ve chosen a 12-month rolling window to show you annual purchases each month here.

Central bank buying was positive throughout much of the 2010s, hovering around $2.5tn year-on-year over 2016-2018, before turning negative in late 2018 and most of 2019. Annual purchases then skyrocketed to nearly $10tn during the pandemic, amid market ebullition from H2 2020 until the Omicron Covid variant dampened sentiment in November 2021 .

Since Q2 2022, annual central bank asset accumulation has been negative, reaching a nadir of some -$3tn in H2 of that year, which was a rough one for most asset classes. From late 2022 and through most of 2023, net buying headed back towards positive territory, with last year witnessing strong, broad-based returns.

In 2024, purchasing is starting to decrease again, which would be a negative signal for markets if the trend is confirmed. This tighter stance aligns with the likelihood that the Fed will keep rates at current levels for much of the year and the Bank of Japan allowing short term rates to increase when it abandoned yield curve control last October.

However, there may be a silver lining for markets. Weak growth and low inflation prints in the Eurozone are likely to lead the ECB to cut rates in 2024. While the ECB may not abandon the quantitative tightening program launched in March 2023, it is unlikely to ramp it up at a time when it needs to loosen policy. This is especially true since it has managed to reduce its balance sheet from €8.8tn in 2022 to around €6.6tn today, as visualized in dollar terms below.

Categories
Geopolitics

Populist forces on the march

With so much of the world headed to the polls in 2024, a quick stock-take of results so far and a look ahead are in order. The outcome of each contest shapes broader international trends of deglobalization.

Of populists & liberals

The paradox is that both populist and liberal political parties have pursued policies leading to international economic fragmentation. On the populist side, trade tariffs à la Trump are the most obvious example. Populism has of course also lead to schisms in western cooperation, whether Republican reticence on NATO and Ukraine, or pro-Russian leadership in Hungary and, more recently, Slovakia (see below).

Liberal political forces are also responsible for deglobalization. The prime example is the widespread use of economic sanctions by the Biden administration and Western Europe against Russia. Yet the current US administration has not only kept the Trump era’s trade barriers in place, it has also introduced more protectionist measures through the landmark Inflation Reduction Act.

Moreover, the success of liberal parties in the broad West can benefit cohesion among allies at the expense of decoupling from opponents. Case in point, Finland’s new president comes from a pro-Europe, pro-NATO party, highlighting how joining NATO bolsters cooperation within the West while also – quite understandably – turning away from Russia.

Populism has the edge

Despite these nuances, a high-level view of electoral outcomes around the world sheds light on the direction that future international economic relationships will take. By the end of the year, the US, India, Indonesia, Mexico, and many other countries will have voted. The question isn’t so much whether the world will continue to fragment, but rather how, which is what monitoring elections can help answer.

So far this year, populist forces have advanced to varying degrees in Slovakia, Indonesia, Senegal, Poland, and will likely maintain power in India. The military continues to loom over politics in Pakistan, while Bangladesh’s authoritarian Awami League has left virtually no space for any opposition.

In contrast, results in Taiwan, Finland, and Turkey have favored more liberal political parties. Similarly, upcoming legislative elections in South Korea will likely see the center-left and center-right parties continue to dominate the political landscape.

Electoral highlights year-to-date

  • Poland: The nationalist, opposition PiS party came out ahead in local elections on April 7th, but Prime Minister Tusk’s ruling coalition will likely hold on to power in most regions.
  • Slovakia: The result of April 6th’s second round runoff in Slovakia are in, with the ascension of pro-Russian politician Peter Pellegrini to the presidency confirming the country’s pivot towards Moscow, after Robert Fico’s return as Prime Minister in October 2023.
  • Turkey: The victory of the opposition Republican People’s Party in local elections on March 31st were a setback to President Erdogan’s ruling AKP, with Istanbul’s mayor Ekrem Imamoglu strengthened by this outcome.
  • Indonesia: The general election on February 14th marks a turn away from incumbent Joko Widodo’s center-left PDI-P to the nationalist, right-wing populist Gerindra party under current defense minister Prabowo Subianto, who will be sworn in as president in October.
  • Pakistan: International media have contested the fairness of the February 8th elections, though former prime minister Imran Khan’s PTI secured the largest share of the vote despite being in prison. The PML-N’s Shehbaz Sharif is now prime minister of a coalition government.
  • Senegal: Political novice Bassirou Diomaye Faye rose to the presidency in the March 24th election, defeating the government-backed candidate. Although Faye has announced several significant policy changes, the composition of his economic team has reassured investors.
  • Taiwan: The results of the January 13th presidential election represent continuity for Taiwan in its opposition to the One China policy, with the center-left DPP’s Lai Ching-te to be inaugurated as president in May 2024.
  • Bangladesh: The US State Department claims that January 7th’s general election wasn’t free and fair. In power since 2009, incumbent Prime Minister Sheikh Hasina of the Awami League has won election for the fourth consecutive time.
  • Finland: The January 28th and February 11th two-round presidential election resulted in the victory of Alexander Stubb, of the pro-NATO, pro-European liberal-conservative National Coalition party.

April elections

  • India: While there is little doubt that Narendra Modi’s BJP will secure victory in the seven-round general election, the Lok Sabha, running from April 19th – June 4th, it appears voters are willing to accept some democratic backsliding in exchange for stronger economic growth.
  • South Korea: The center-left DPK holds the most seats in the National Assembly, while its historic rival, the conservative PPP, holds the presidency. These two main parties appear to be neck and neck in polling for the April 10th legislative election.